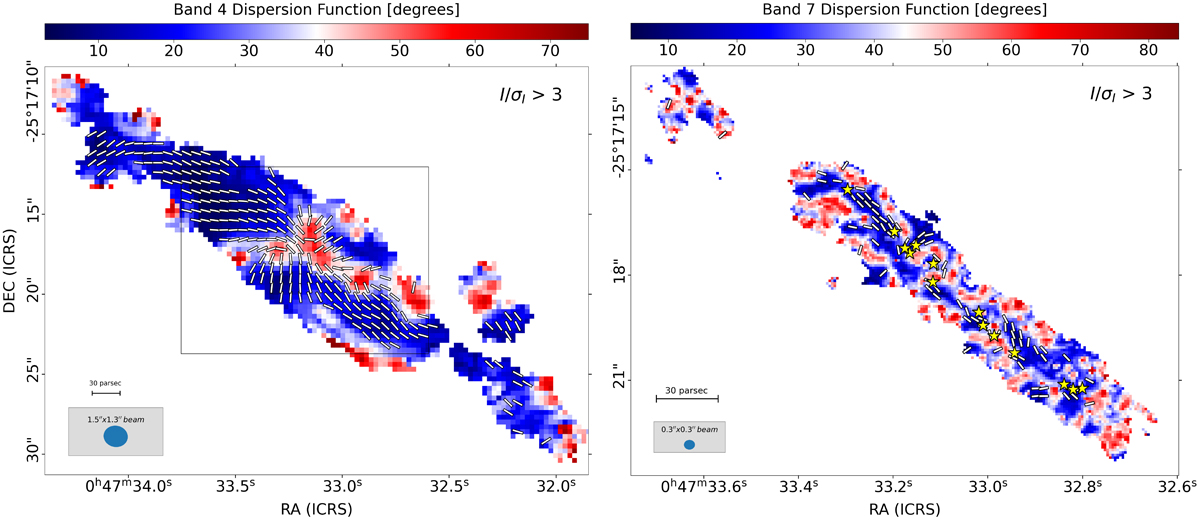
Fig. 3.
Download original image
Polarisation angle dispersion function in the centre of NGC253. Maps of the polarisation angle dispersion function obtained using the Band 4 (left) and Band 7 (right) data. Only pixels with I/σI > 3 in total intensity are shown. Vectors indicating the orientation of the B field vectors are overlaid only in correspondence of pixels where PI/σPI > 3. Yellow stars indicate the positions of the SSCs catalogued by Leroy et al. (2018).
Current usage metrics show cumulative count of Article Views (full-text article views including HTML views, PDF and ePub downloads, according to the available data) and Abstracts Views on Vision4Press platform.
Data correspond to usage on the plateform after 2015. The current usage metrics is available 48-96 hours after online publication and is updated daily on week days.
Initial download of the metrics may take a while.