Fig. A.2.
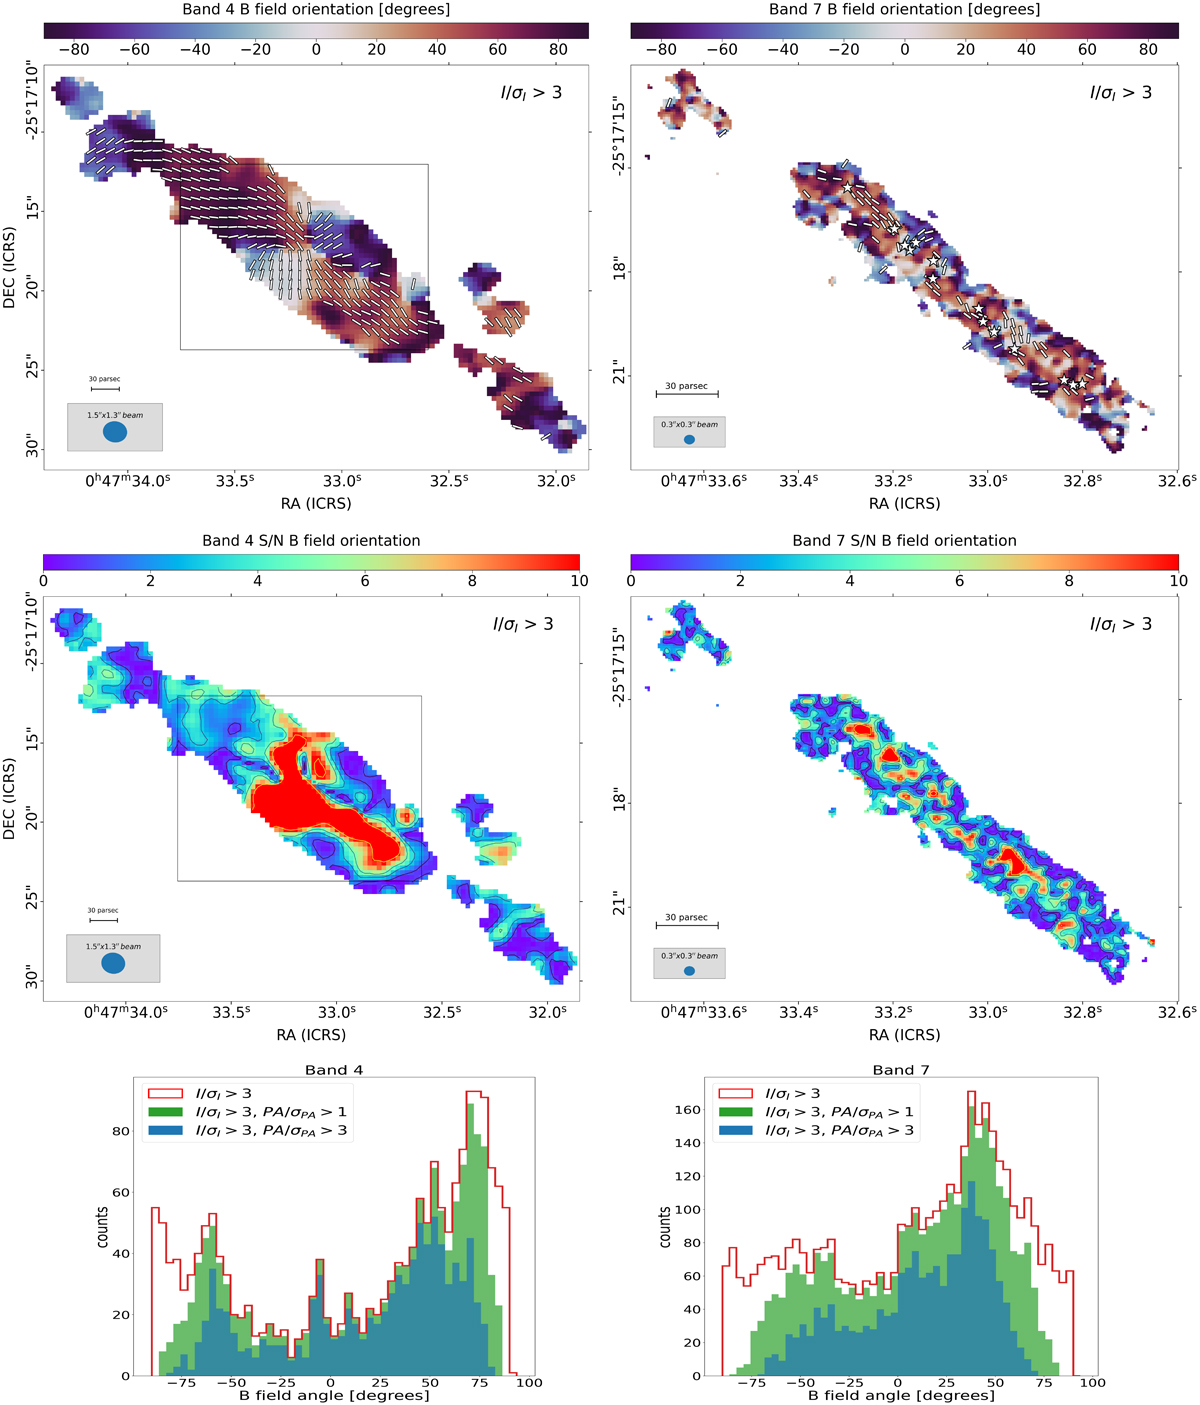
Download original image
Magnetic field orientation in the centre of NGC253. Upper panels: Maps and corresponding vectors of the magnetic field orientation, obtained rotating the observed polarisation angle by 90 degrees. The vectors indicate the magnetic field orientation and are displayed only at pixels where PI/σPI > 3. Centre panels: S/N maps of the B field orientation with contours corresponding to [1, 3, 5, 10]×PA/σPA. White stars in the lower left panel indicate the positions of the SSCs catalogued by Leroy et al. 2018. Both maps have been obtained selecting pixels with total intensity above 3 sigma. Bottom panels: Histograms of the B field orientation pixel values in each map. Results from Band 4 and Band 7 observations are shown in the top row and the bottom row, respectively. The plot annotations and pixel selection criteria are the same as in Figure 2.
Current usage metrics show cumulative count of Article Views (full-text article views including HTML views, PDF and ePub downloads, according to the available data) and Abstracts Views on Vision4Press platform.
Data correspond to usage on the plateform after 2015. The current usage metrics is available 48-96 hours after online publication and is updated daily on week days.
Initial download of the metrics may take a while.