Fig. 11.
Download original image
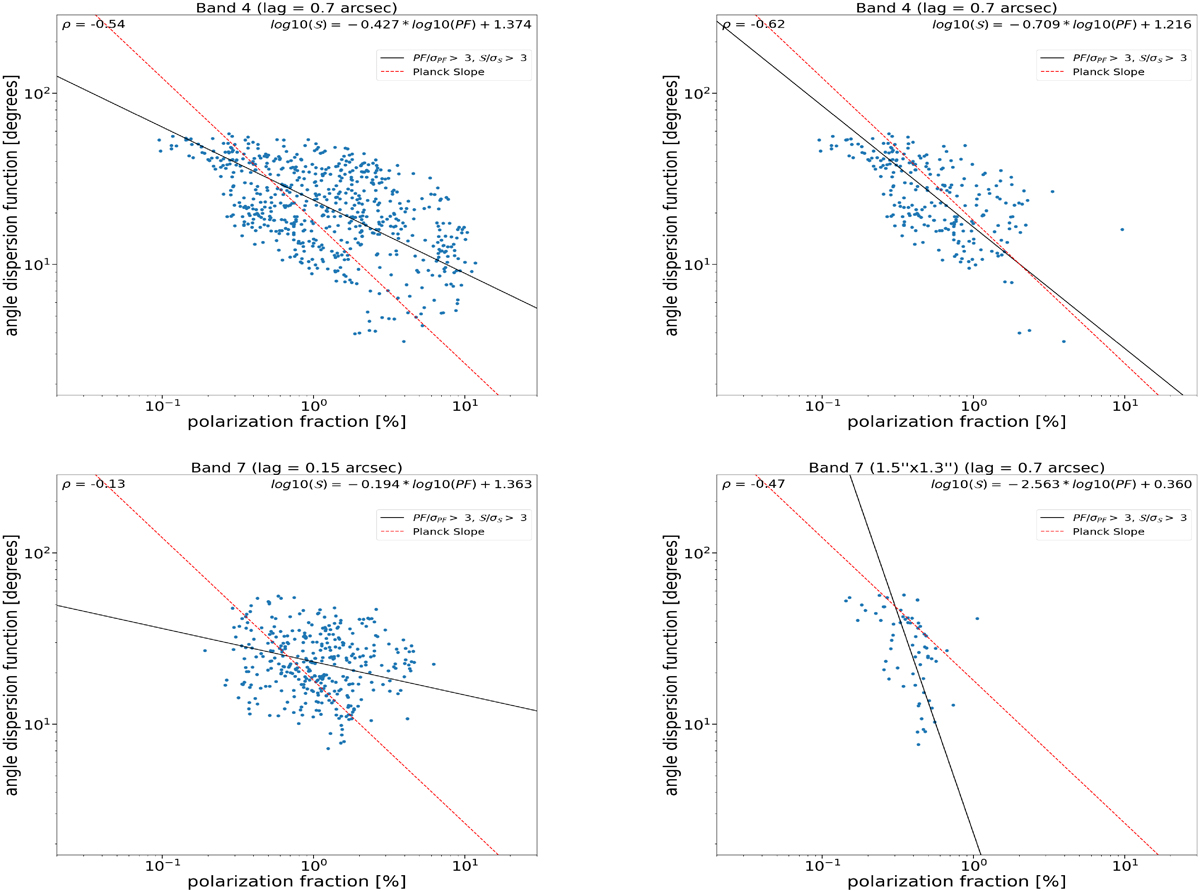
Observed polarisation angle dispersion 𝒮 as a function of the polarisation fraction PF. Band 4 data are shown on the top left panel, Band 7 on the bottom left. On each plot, the black dashed line shows the trend derived from best fitting the data (see Equation (10)) excluding all pixels characterised by I/σI < 3, PF/σPF < 3 and 𝒮/σ𝒮 < 3, while the red line shows the best correlation obtained for the solar neighbourhood in the MW from the Planck data for reference. The upper right panel and the lower right panel shows the same plots computed in Band 4 and Band 7 smoothed at the common resolution of 1.5″ × 1.3″ using pixels belonging exclusively in the central starburst region, defined by the mask identified in Band 7 (at its native resolution) including pixels with S/N in total intensity larger than 3. On top of each panel the lag used to computed the angle dispersion function 𝒮 is indicated.
Current usage metrics show cumulative count of Article Views (full-text article views including HTML views, PDF and ePub downloads, according to the available data) and Abstracts Views on Vision4Press platform.
Data correspond to usage on the plateform after 2015. The current usage metrics is available 48-96 hours after online publication and is updated daily on week days.
Initial download of the metrics may take a while.