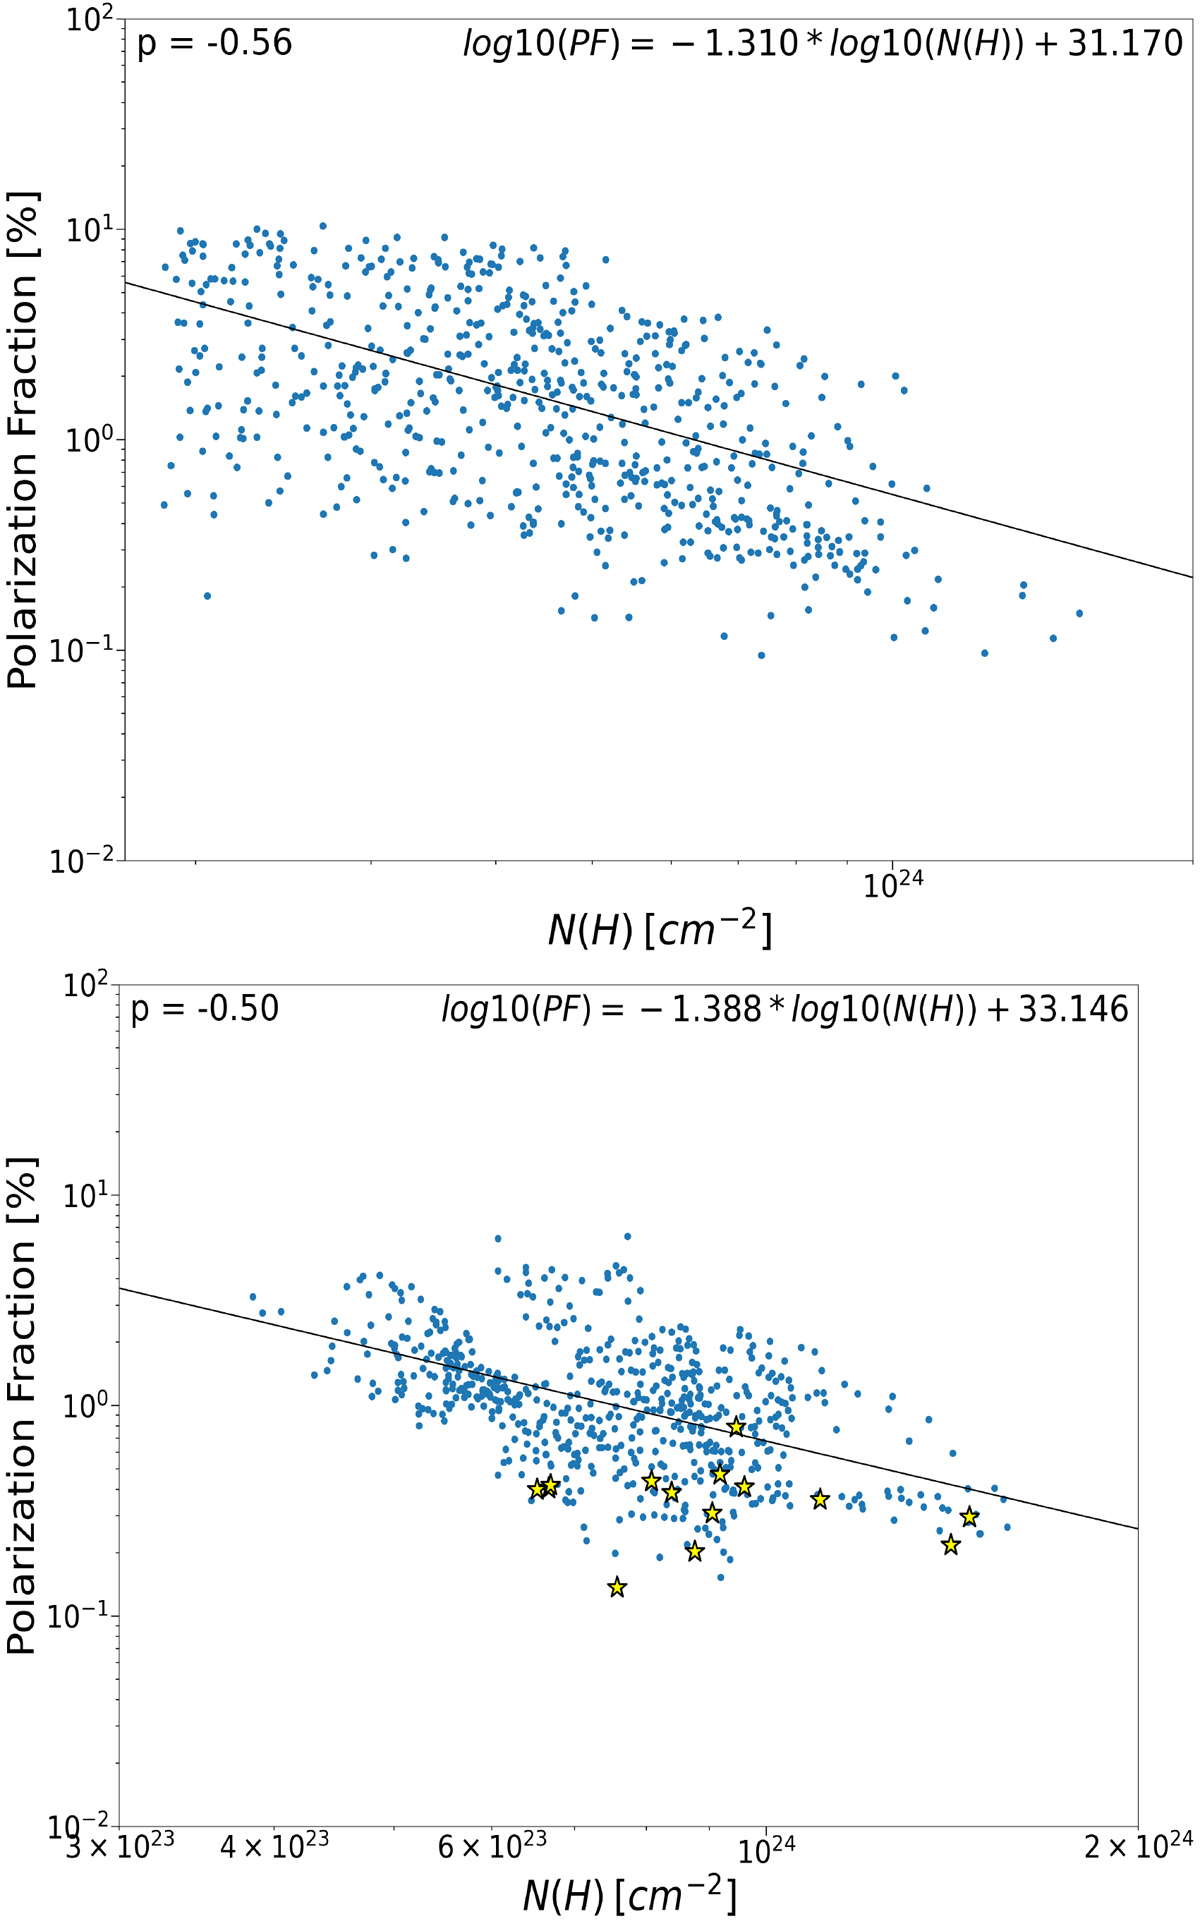
Fig. 10.
Download original image
Scatter plot of the observed polarisation fraction PF as a function of gas column density in NGC253. Band 4 data are shown on top panel, Band 7 in the bottom panel. The black line shows the trend derived from a fit to our data (see Eq. (8)). The yellow stars in the bottom panel indicate values computed at the location of the 14 SSCs (see Fig. 4).
Current usage metrics show cumulative count of Article Views (full-text article views including HTML views, PDF and ePub downloads, according to the available data) and Abstracts Views on Vision4Press platform.
Data correspond to usage on the plateform after 2015. The current usage metrics is available 48-96 hours after online publication and is updated daily on week days.
Initial download of the metrics may take a while.