Fig. 1.
Download original image
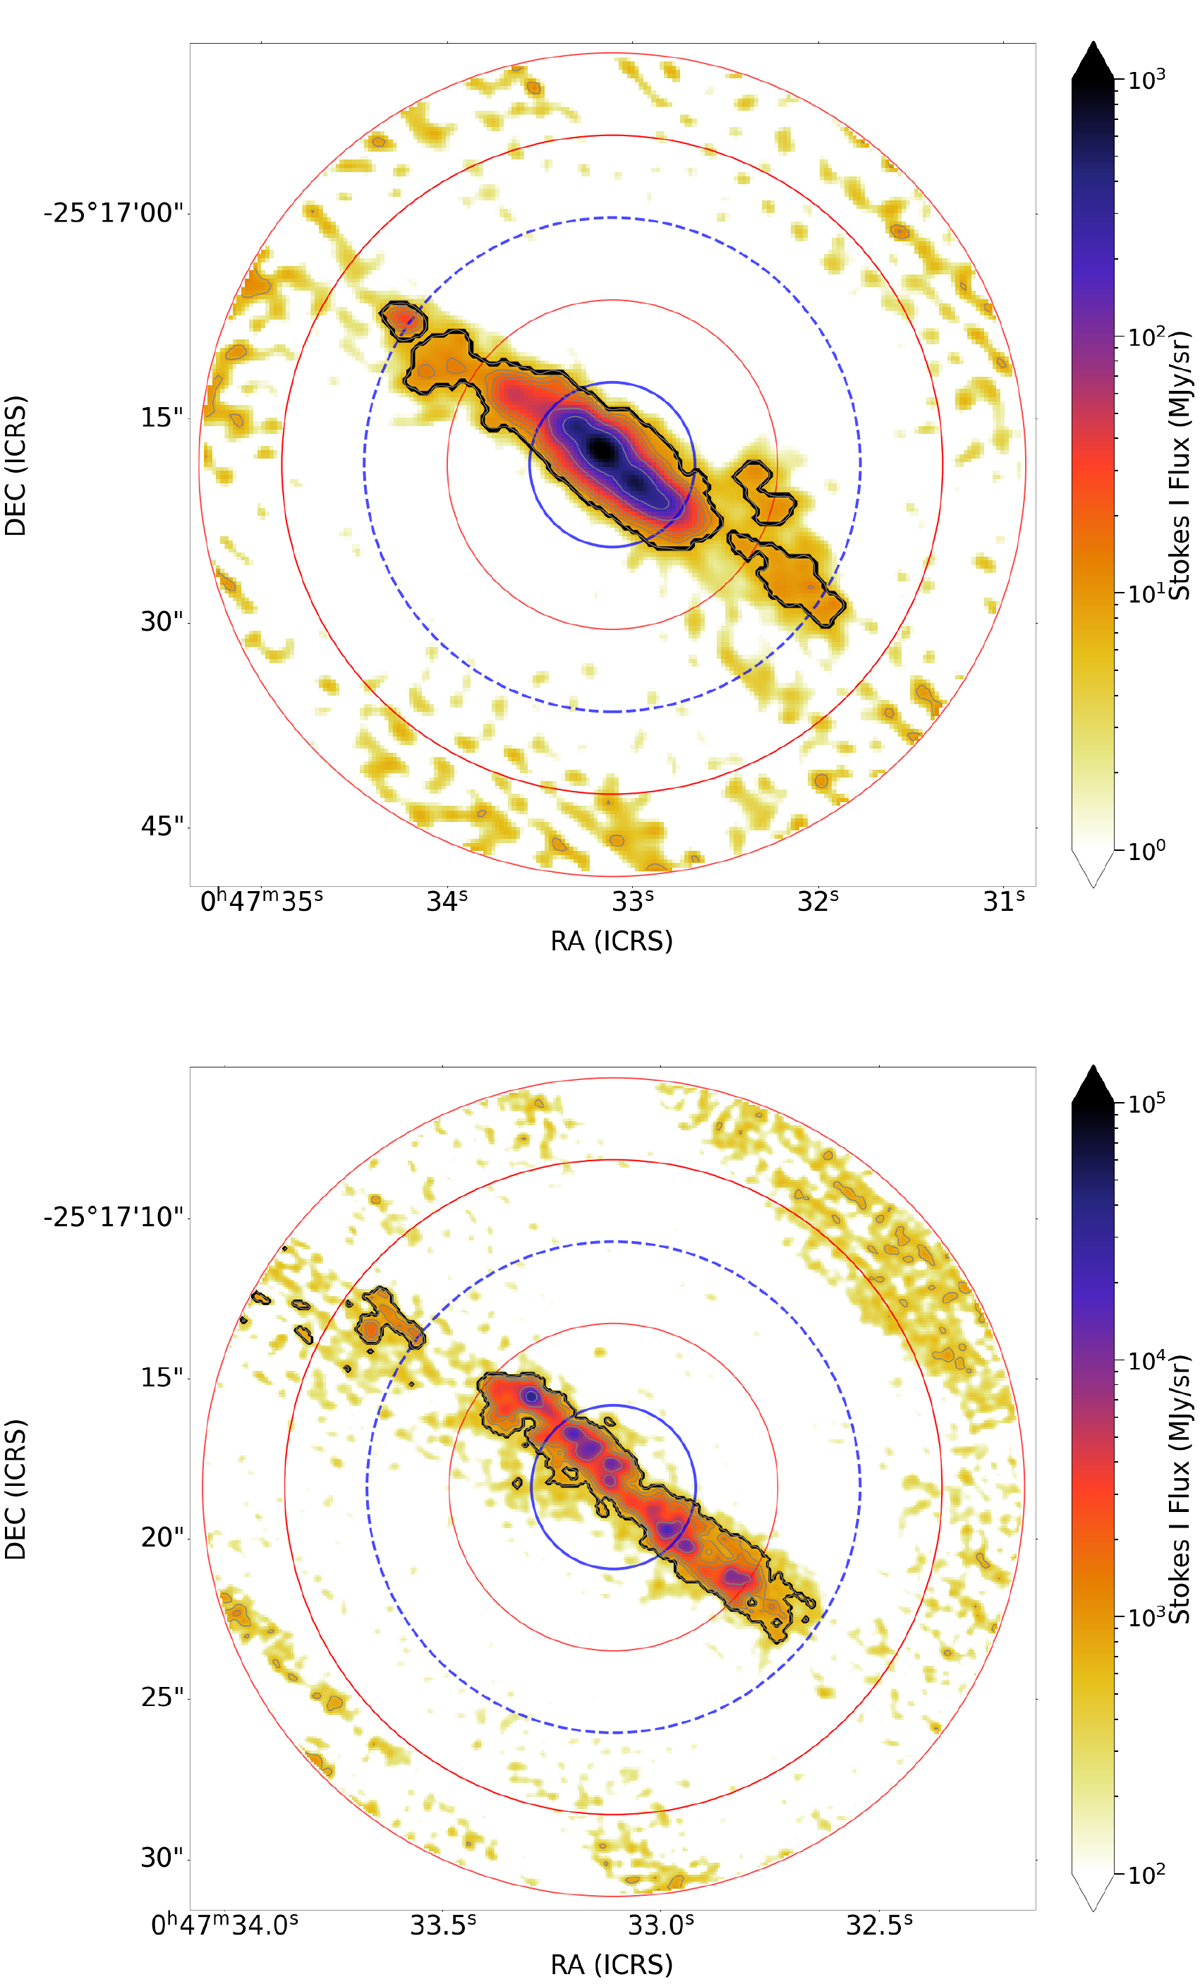
Total intensity images. Band 4 (∼145 GHz) is shown on the top panel, Band 7 (∼345 GHz) on the bottom panel. The thick black contour corresponds to 3 × σI, while the grey thin contours correspond to [5, 7, 10, 30, 100]×σI. The concentric circles overlaid on the images are the annular regions used for the noise analysis (see Sect. 2.5). The thick and dotted blue circles correspond to 1/3 of the HPBW and the full HPBW of the image, respectively. The red circles have as radii multiples of n * 1/3 of the HPBW, where n ranges from 2 to 5.
Current usage metrics show cumulative count of Article Views (full-text article views including HTML views, PDF and ePub downloads, according to the available data) and Abstracts Views on Vision4Press platform.
Data correspond to usage on the plateform after 2015. The current usage metrics is available 48-96 hours after online publication and is updated daily on week days.
Initial download of the metrics may take a while.