Fig. A.1
Download original image
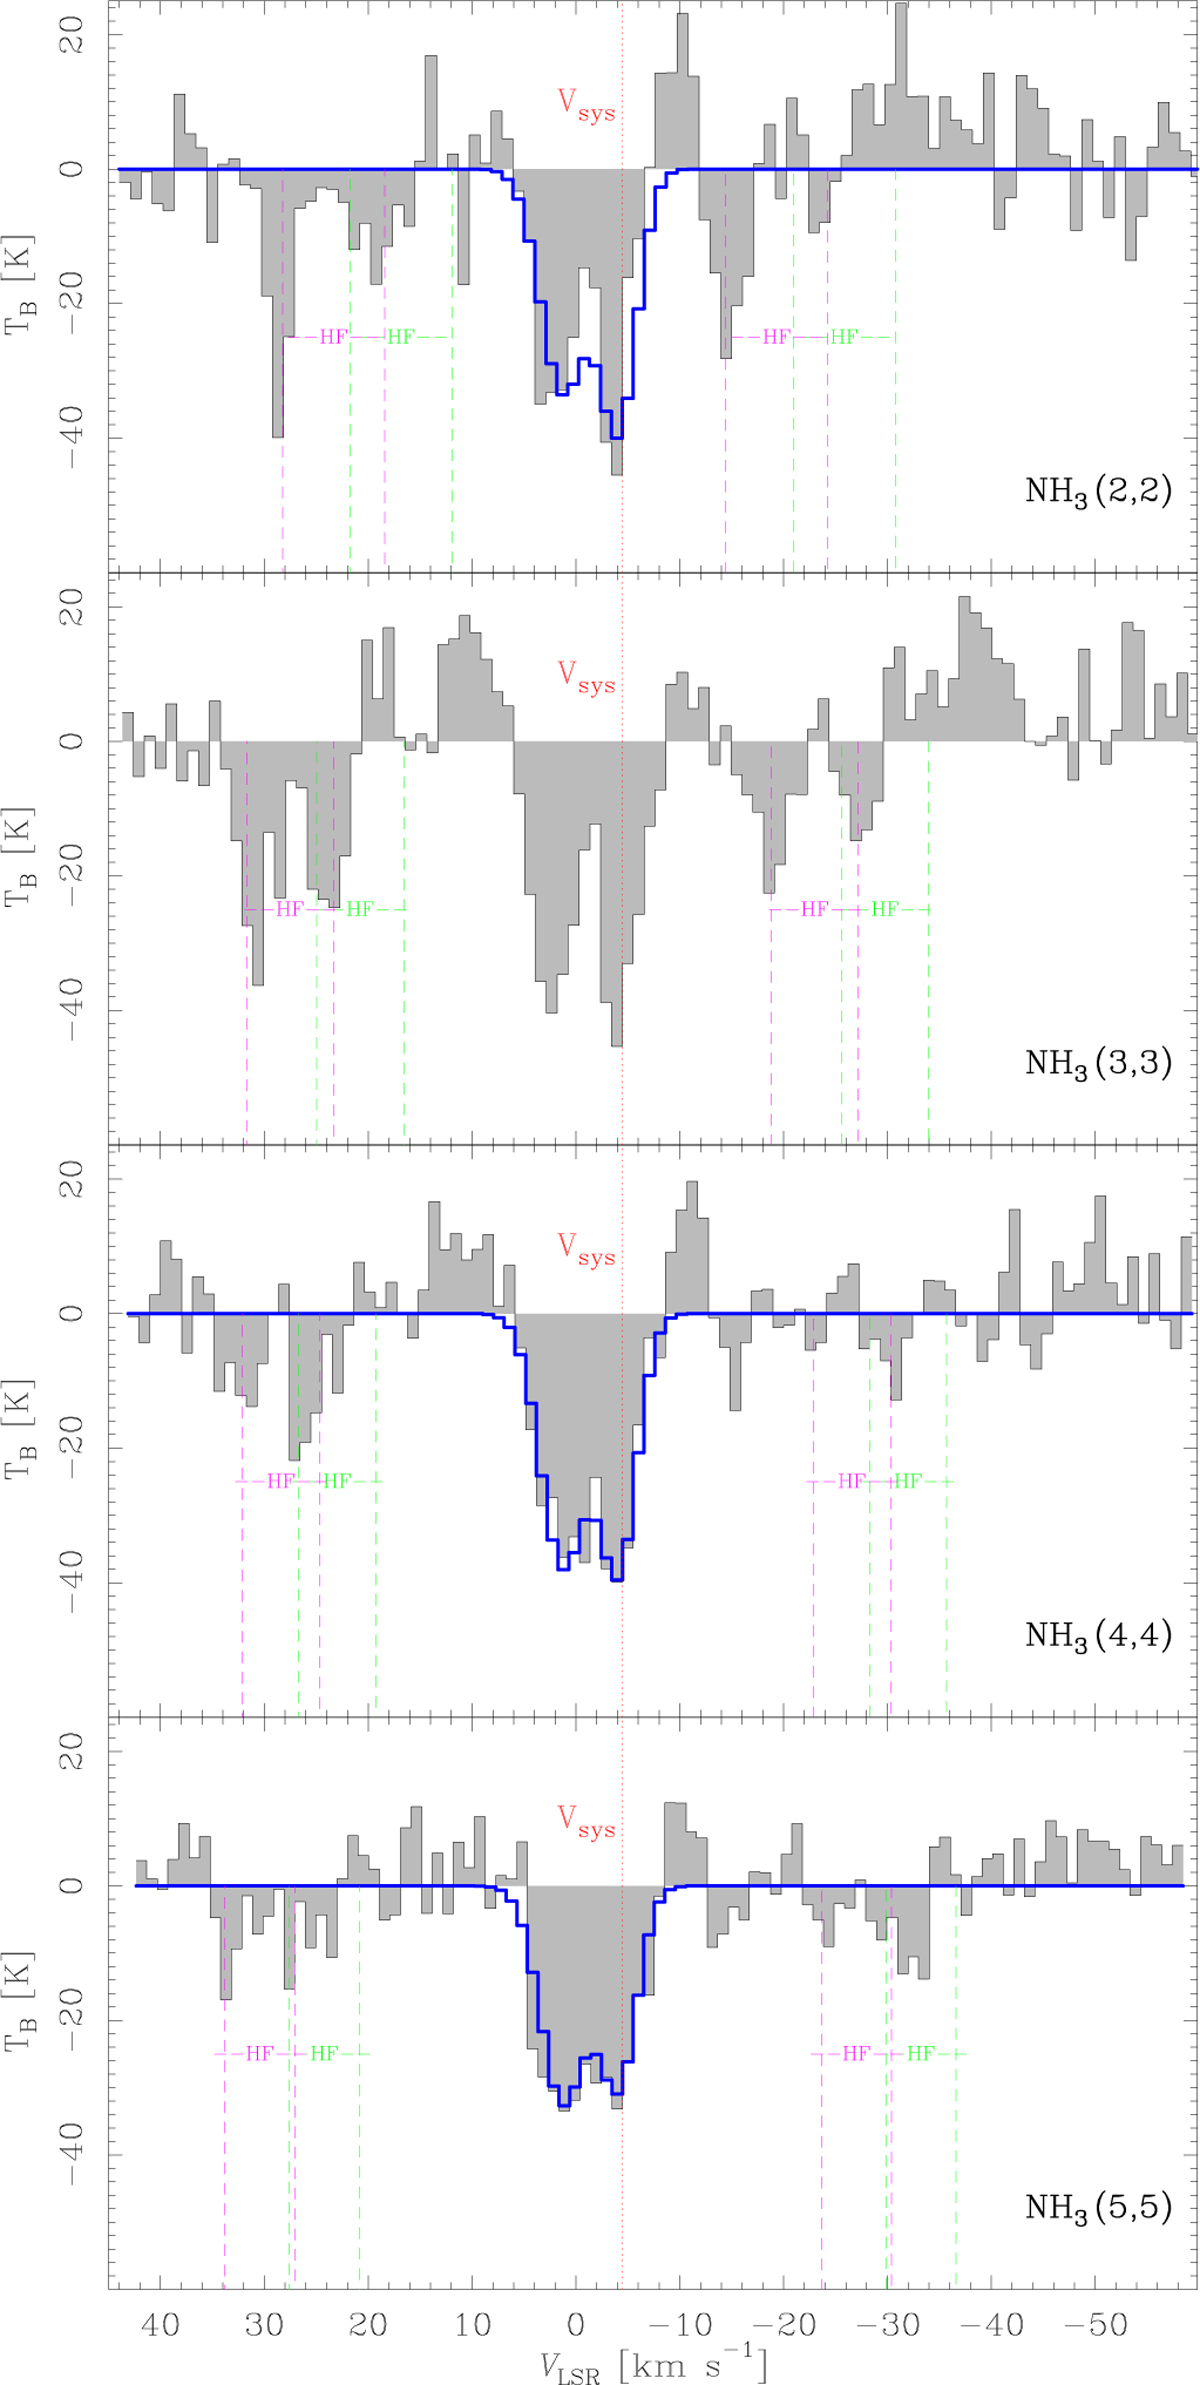
Integrated spectra of the NH3 line emission (gray) evaluated over the central absorption region. From top to bottom are displayed spectra of the inversion lines from (2, 2) to (5, 5) as labelled on the bottom right. The absorption feature near the systemic velocity of the region, indicated with a dotted red line (Vsys), is the combination of two, distinct, velocity components. Theoretical positions of the satellite hyperfine lines (HF) are approximately indicated for both components in green and magenta separately, whereas the blue profile draws the best fit spectrum to the ammonia para lines.
Current usage metrics show cumulative count of Article Views (full-text article views including HTML views, PDF and ePub downloads, according to the available data) and Abstracts Views on Vision4Press platform.
Data correspond to usage on the plateform after 2015. The current usage metrics is available 48-96 hours after online publication and is updated daily on week days.
Initial download of the metrics may take a while.