Fig. 7
Download original image
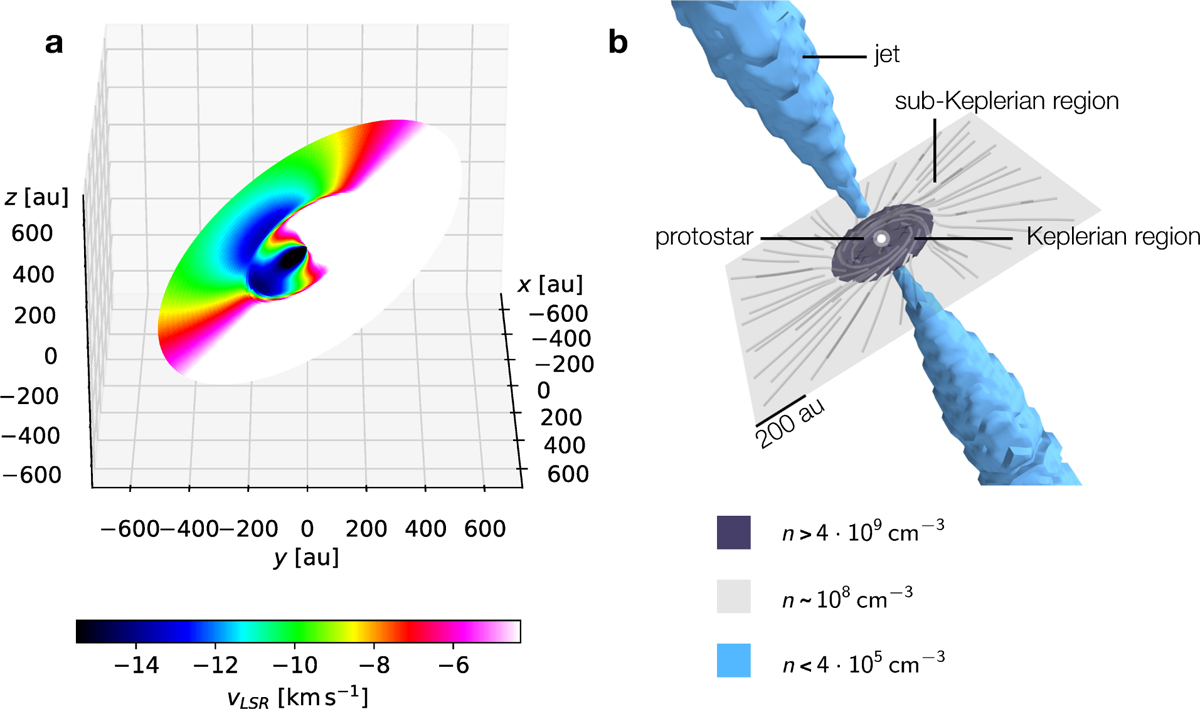
3D view of the accretion disk kinematics as obtained from the selected simulation, taken after t = 9.62 kyr from its beginning. To the left, panel (a) shows the theoretical pattern of line-of-sight velocities within a similar range as Fig. 5 for a direct comparison, including also the inner disk regions where the rotation curve becomes Keplerian (masked by absorption in our observations). To the right, panel (b) shows the entire disk and jet structures produced by the selected simulation, where the reference levels of hydrogen volume density are listed for the accretion disk (Keplerian and sub-Keplerian regions separately) and the jet.
Current usage metrics show cumulative count of Article Views (full-text article views including HTML views, PDF and ePub downloads, according to the available data) and Abstracts Views on Vision4Press platform.
Data correspond to usage on the plateform after 2015. The current usage metrics is available 48-96 hours after online publication and is updated daily on week days.
Initial download of the metrics may take a while.