Fig. 5
Download original image
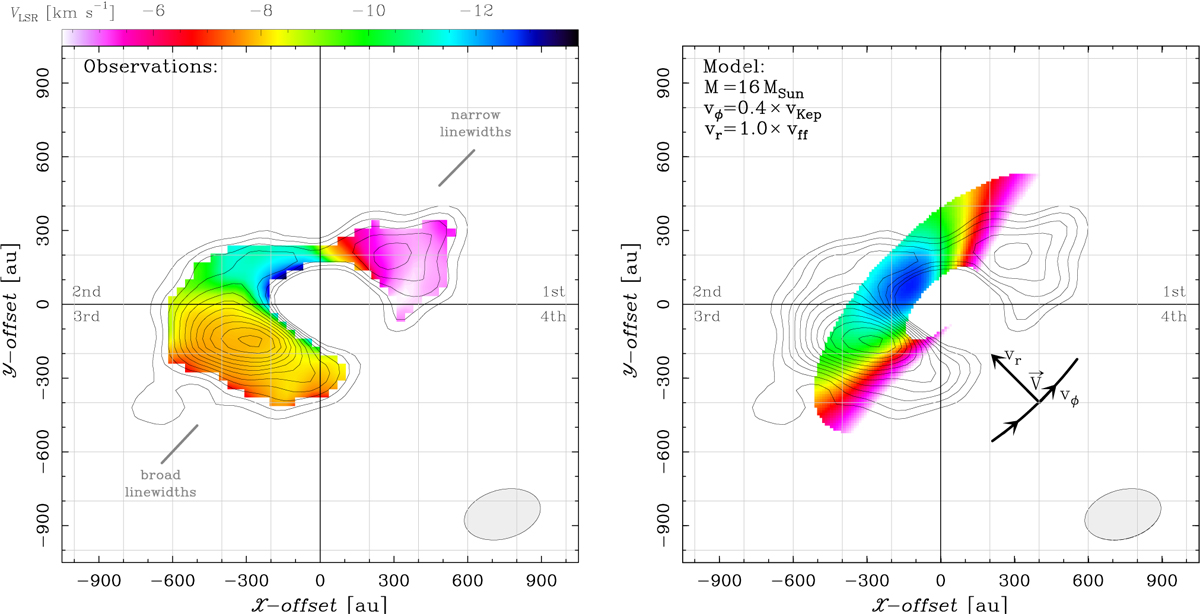
Comparison between observations (left panel) and a toy model (right panel) which reproduces the line-of-sight velocity pattern of ammonia. Left: same as the bottom panel of Fig. 1, but with the axes labelled in astronomical units and offsets counted from the star position. A grid is drawn at steps of 200 au for a direct comparison with the right panel and the quadrants are labelled. The third quadrant shows a velocity gradient that is much smoother than in the first quadrant due to ammonia linewidths being twice as broad (Fig. 4). Right: similar to the left panel, but with the colour map obtained from the toy model of a razor thin disk with the same geometry of circumstellar gas around HW2 and convolved with the same instrumental beam. Model parameters are written in the top-left, with the velocity vectors sketched in the fourth quadrant.
Current usage metrics show cumulative count of Article Views (full-text article views including HTML views, PDF and ePub downloads, according to the available data) and Abstracts Views on Vision4Press platform.
Data correspond to usage on the plateform after 2015. The current usage metrics is available 48-96 hours after online publication and is updated daily on week days.
Initial download of the metrics may take a while.