Fig. 4
Download original image
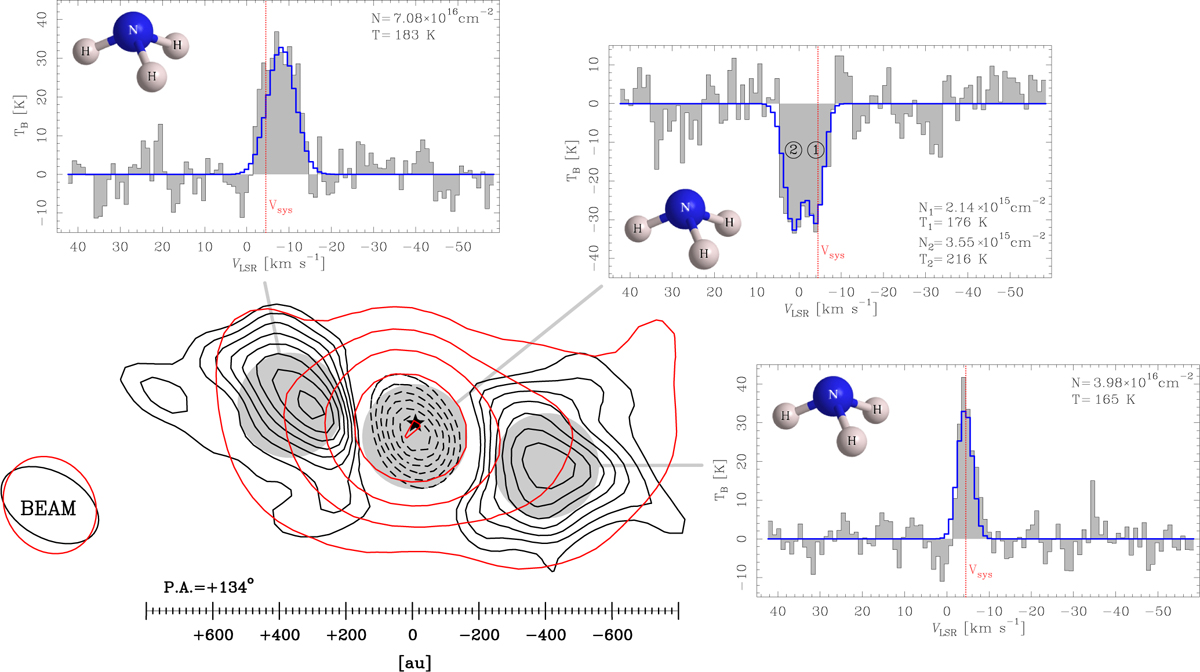
Gas physical conditions near HW2. Bottom left: spatial extent of the NH3 (5, 5) bulk emission (black contours, same as Fig. 1) as compared to the dust emission (red contours) mapped in continuum at 1.37 mm by Beuther et al. (2018). Red contours start from a threshold of 27 mJy beam−1 increasing by a factor 2. The equatorial reference frame is rotated clockwise by 44° to align the (projected) outflow direction with the vertical axis of the plot (linear scale to the bottom). Large grey spots mark the loci where side spectra were integrated. Side panels: spectra of the local NH3 (5, 5) emission (grey histograms) extracted at the position of the peaks of emission and absorption. In each panel, the blue profile draws the best fit spectrum to the NH3 emission with fitted parameters of excitation temperature (T) and column density (N) written in the corners. The systemic velocity (Vsys) of circumstellar gas is marked with a red, vertical, dotted line and the 3D molecular structure is sketched.
Current usage metrics show cumulative count of Article Views (full-text article views including HTML views, PDF and ePub downloads, according to the available data) and Abstracts Views on Vision4Press platform.
Data correspond to usage on the plateform after 2015. The current usage metrics is available 48-96 hours after online publication and is updated daily on week days.
Initial download of the metrics may take a while.