Fig. 2
Download original image
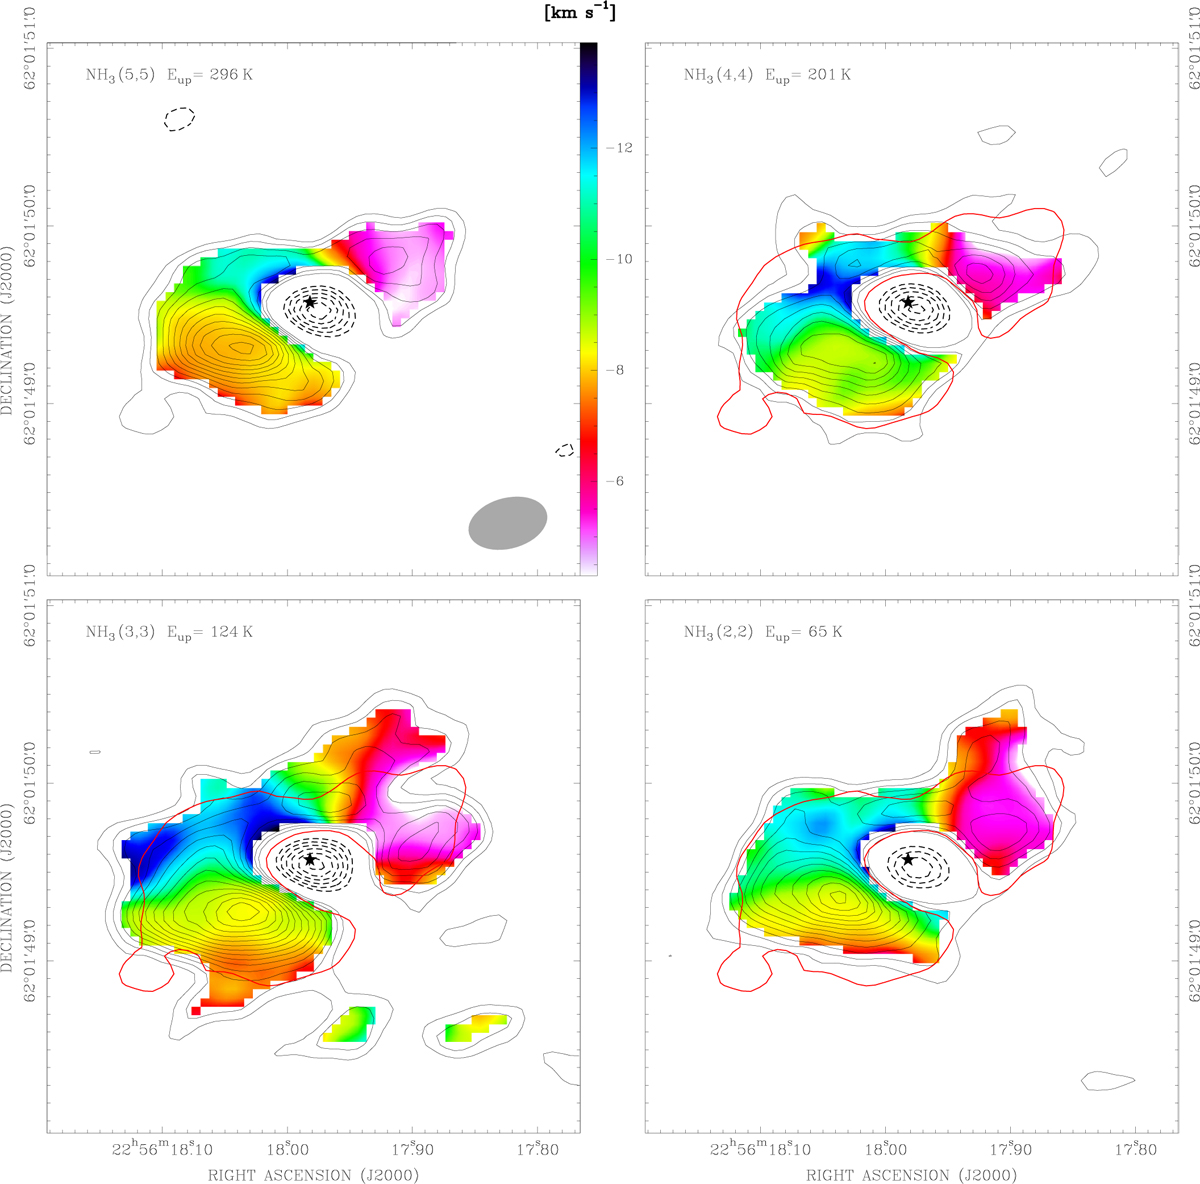
Comparison of the NH3 gas kinematic among the inversion lines from (2, 2) to (5, 5), as indicated in the top left with upper excitation energies. Each panel shows a first-moment map of a given line (colour map) with overplotted its moment zero contours. Moments are calculated over the same velocity range (see Fig. 1) and the velocity scale is quantified by the colour wedge in the top left panel. Positive contours start at 3 σ and increase by 1 σ of 2.6 mJy beam−1 km s−1; negative (dashed) contours start at −3 σ by steps of −2 σ. The first-moment maps are evaluated within the 4 σ contour of their moment zero map; the thick red contour draws the 3 σ contour of the NH3 (5, 5) map for comparison with other lines. Same field of view and resolution as in Fig. 1 (beam size shown in the top-left panel).
Current usage metrics show cumulative count of Article Views (full-text article views including HTML views, PDF and ePub downloads, according to the available data) and Abstracts Views on Vision4Press platform.
Data correspond to usage on the plateform after 2015. The current usage metrics is available 48-96 hours after online publication and is updated daily on week days.
Initial download of the metrics may take a while.