Fig. B.1
Download original image
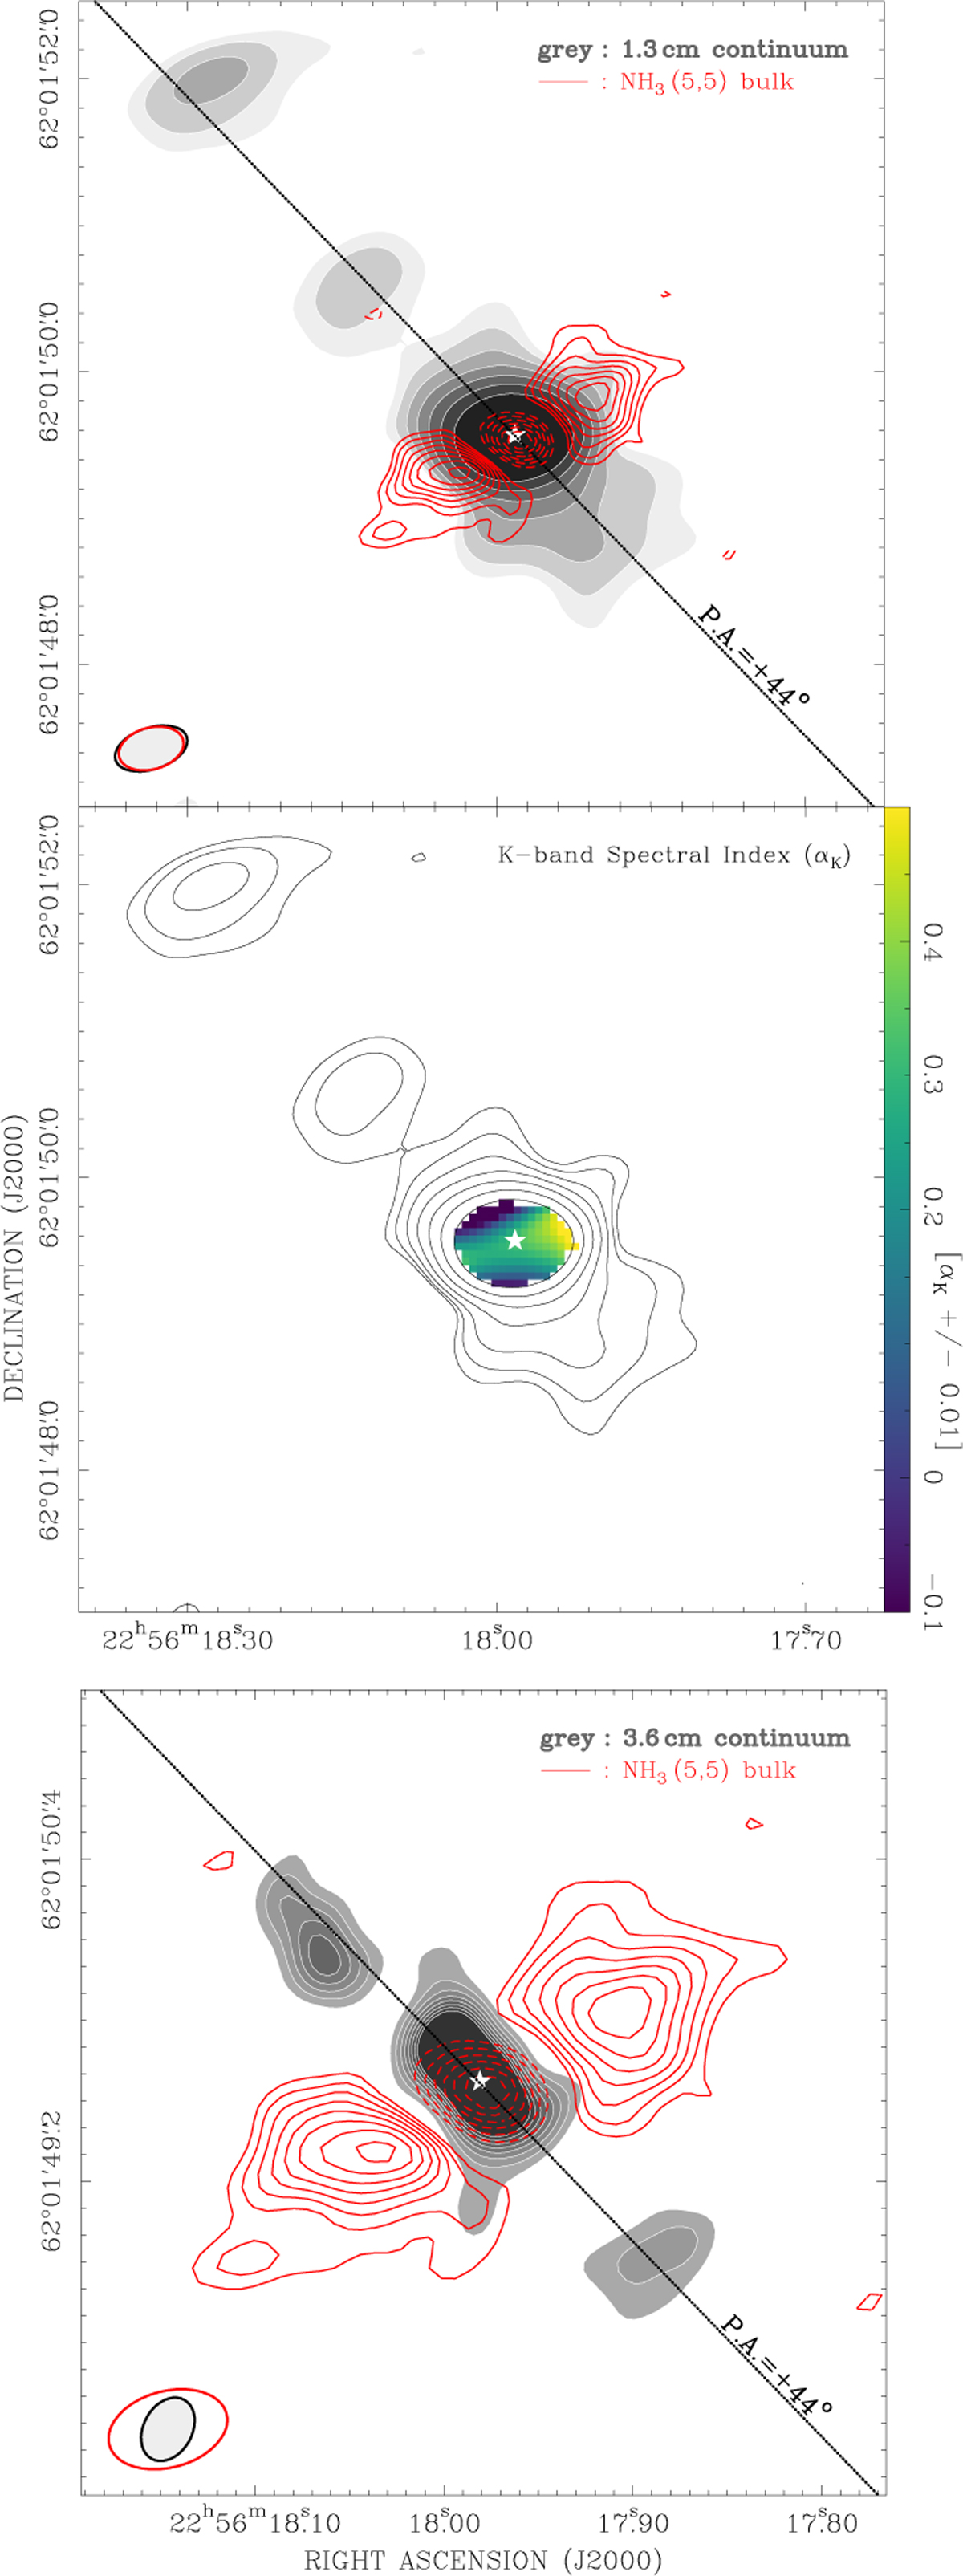
Thermal radio jet emission (grey shades) driven by HW2 (white star) compared with the spatial distribution of the NH3 emission (red contours). Top: radio continuum emission at 1.3 cm (K band), obtained from the same NH3 dataset, overplotted on the (5, 5) inversion line emission near the systemic velocity. Radio continuum levels start at 7 σ increasing by factors of 2 (1 σ of 5 μJy beam−1). The dotted black line traces the mean jet axis at a position angle of 44° for comparison. Synthesized beams on the bottom left. Middle: In-band spectral index map (colours) measured from the K-band radio continuum (black contours, same as upper panel). Values according to the colour wedge to the right. Bottom: Similar to the upper panel but for the radio continuum emission at 3.6 cm (X band; see Appendix B) and a field of view two times smaller. Radio continuum levels start at 5 σ increasing at steps of 3 σ (1 σ of 36 μJy beam−1).
Current usage metrics show cumulative count of Article Views (full-text article views including HTML views, PDF and ePub downloads, according to the available data) and Abstracts Views on Vision4Press platform.
Data correspond to usage on the plateform after 2015. The current usage metrics is available 48-96 hours after online publication and is updated daily on week days.
Initial download of the metrics may take a while.