Fig. A.5
Download original image
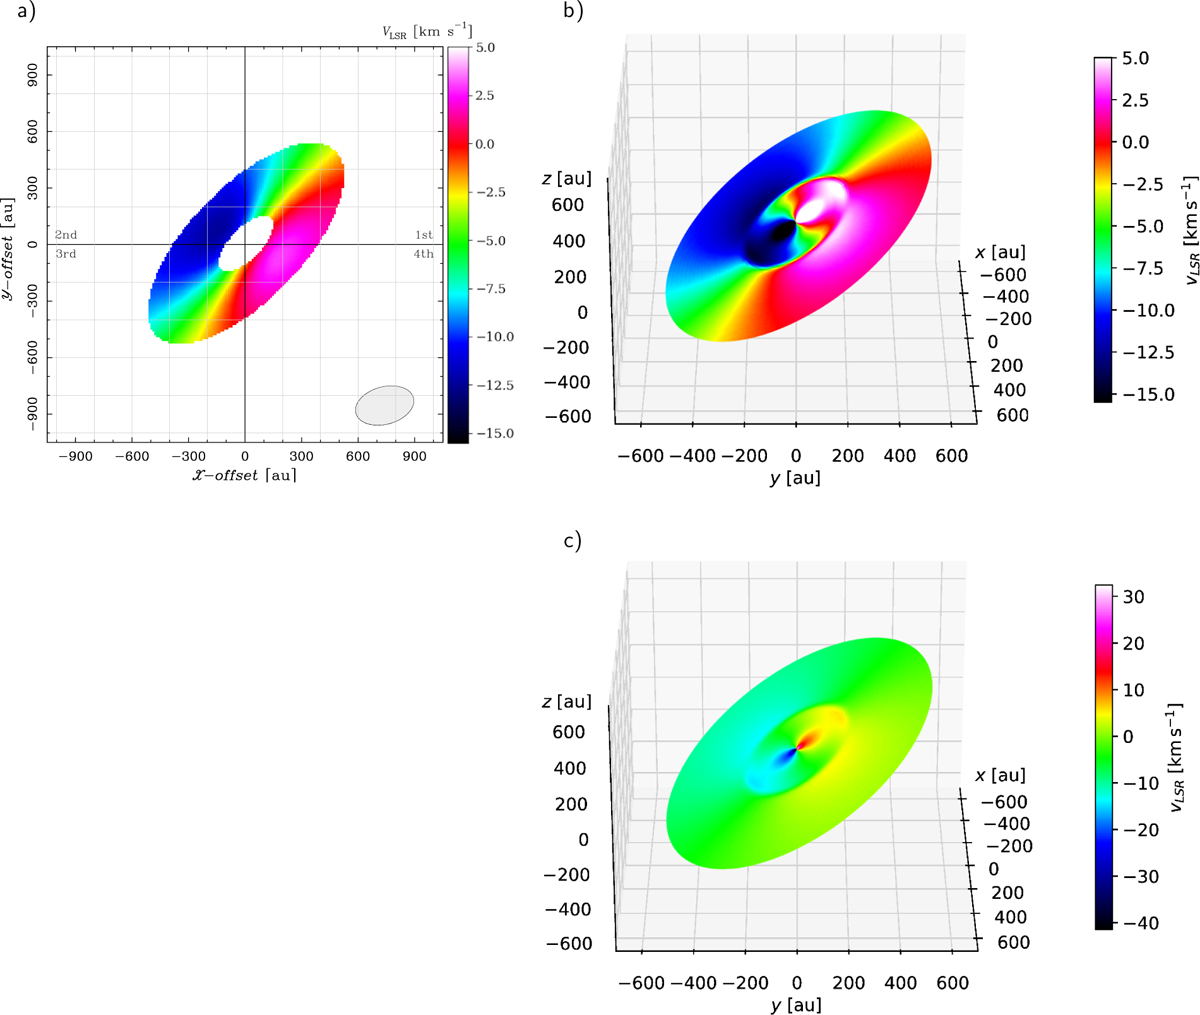
Full velocity field of circumstellar gas around HW2, as predicted by the toy model (panel a) and the simulations (panels b and c). These plots are produced under the same conditions as in the right panel of Fig. 5 (for the toy model) and Fig. 7a (for the simulations), but show the full range of gas velocities expected theoretically. In particular, in panel a), velocities coloured from orange to magenta cover the range of absorption observed in the ammonia spectra. Panel b) shows the simulated velocities plotted with the same colour scale of the toy model to the left, for comparison. We explicitly note that the toy model and simulations predict consistent velocities with each other (cf. Figs. 5 and 7a). Panel c) shows the simulated velocities with a larger velocity range, to include the innermost and fastest (Keplerian) velocities not covered by the toy model.
Current usage metrics show cumulative count of Article Views (full-text article views including HTML views, PDF and ePub downloads, according to the available data) and Abstracts Views on Vision4Press platform.
Data correspond to usage on the plateform after 2015. The current usage metrics is available 48-96 hours after online publication and is updated daily on week days.
Initial download of the metrics may take a while.