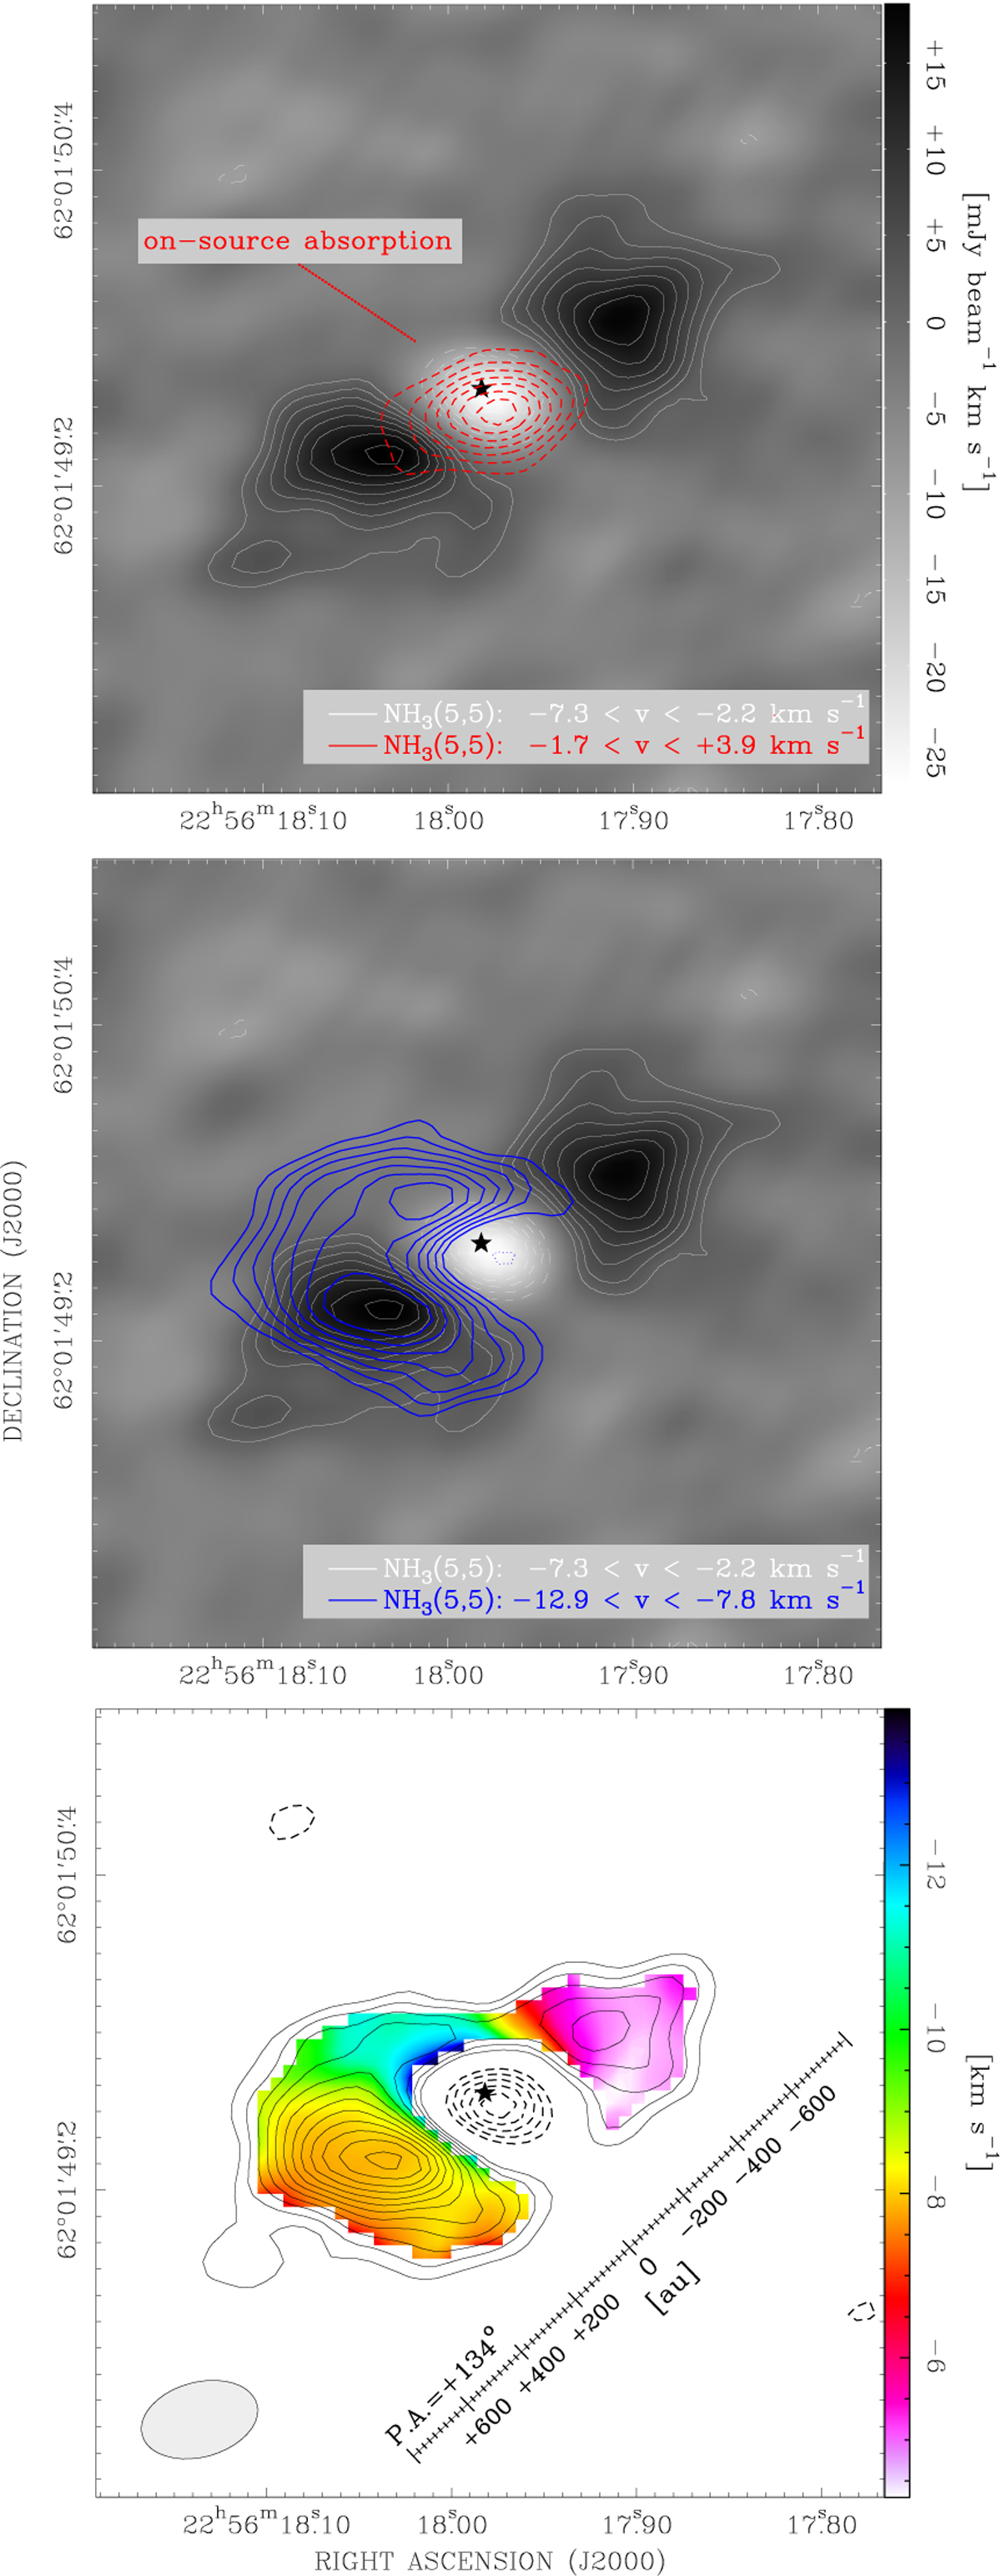
Fig. 1
Download original image
Accretion disk in ammonia surrounding HW2 (black star). Top: moment zero maps of the (5, 5) inversion line evaluated within two velocity ranges, as indicated on the bottom right (beam size on the bottom panel). White contours and grey background quantify the line brightness about the systemic velocity, whereas the red-dashed contours the red-shifted absorption observed against the central region. Contours start at 3 σ increasing by 1 σ of 1.8 mJy beam−1 km s−1; dashed (negative) contours start at −3 σ decreasing by 2 σ. Middle: similar to the top panel, but with the moment zero map at red-shifted velocities replaced by one at blue-shifted velocities. Bottom: moment zero (black contours) and first moment (colours) maps obtained by combining the systemic and blue-shifted ranges, with velocities quantified by the colour wedge to the right. Same contour levels as the upper panels, with 1 σ of 2.6 mJy beam−1 km s−1. A linear scale is drawn along a position angle of 134° east of north and all panels show the same field.
Current usage metrics show cumulative count of Article Views (full-text article views including HTML views, PDF and ePub downloads, according to the available data) and Abstracts Views on Vision4Press platform.
Data correspond to usage on the plateform after 2015. The current usage metrics is available 48-96 hours after online publication and is updated daily on week days.
Initial download of the metrics may take a while.