Fig. 7
Download original image
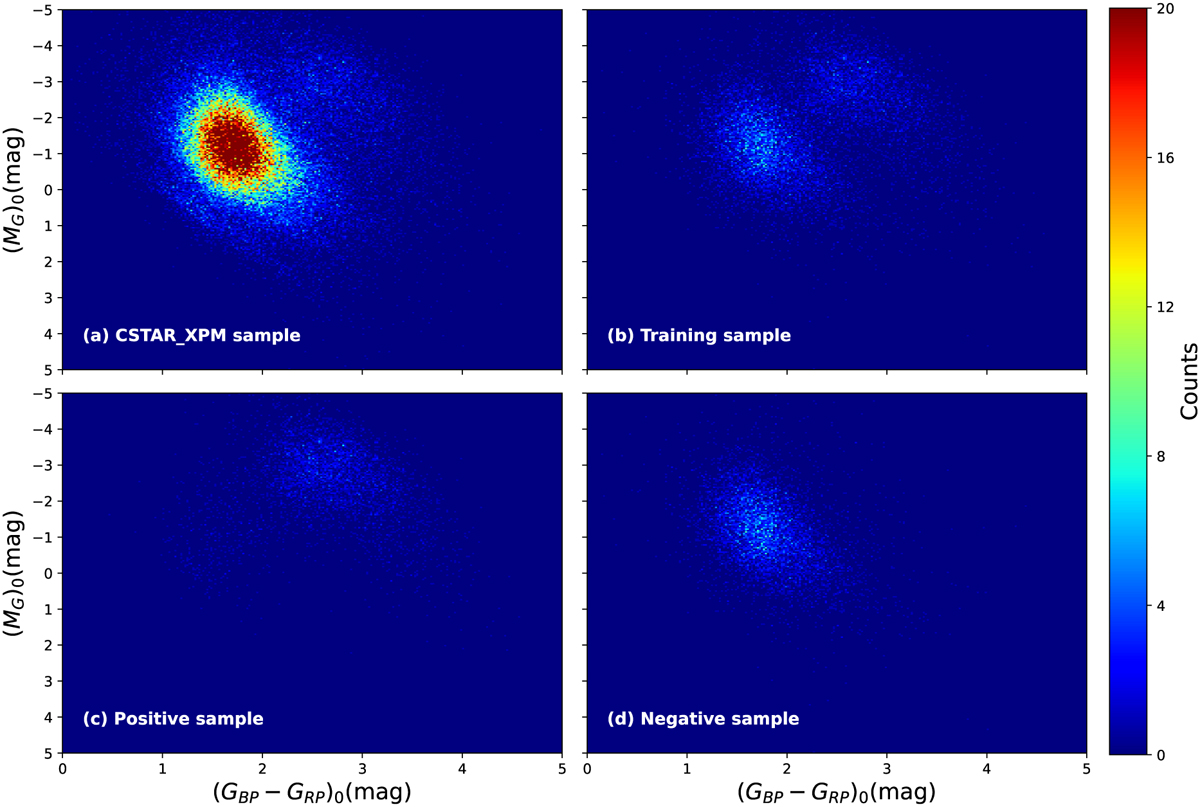
Distribution of CSTAR_XPM and the training sample on (MG)0 versus the (GBP − GRP)0 diagram. All the samples have been corrected for 3D extinction. Panel a: Distribution of the CSTAR sample. Panel b: Distribution of the training sample. Panel c: Distribution of carbon stars from the training sample. Panel d: Distribution of non-carbon stars from the training sample.
Current usage metrics show cumulative count of Article Views (full-text article views including HTML views, PDF and ePub downloads, according to the available data) and Abstracts Views on Vision4Press platform.
Data correspond to usage on the plateform after 2015. The current usage metrics is available 48-96 hours after online publication and is updated daily on week days.
Initial download of the metrics may take a while.