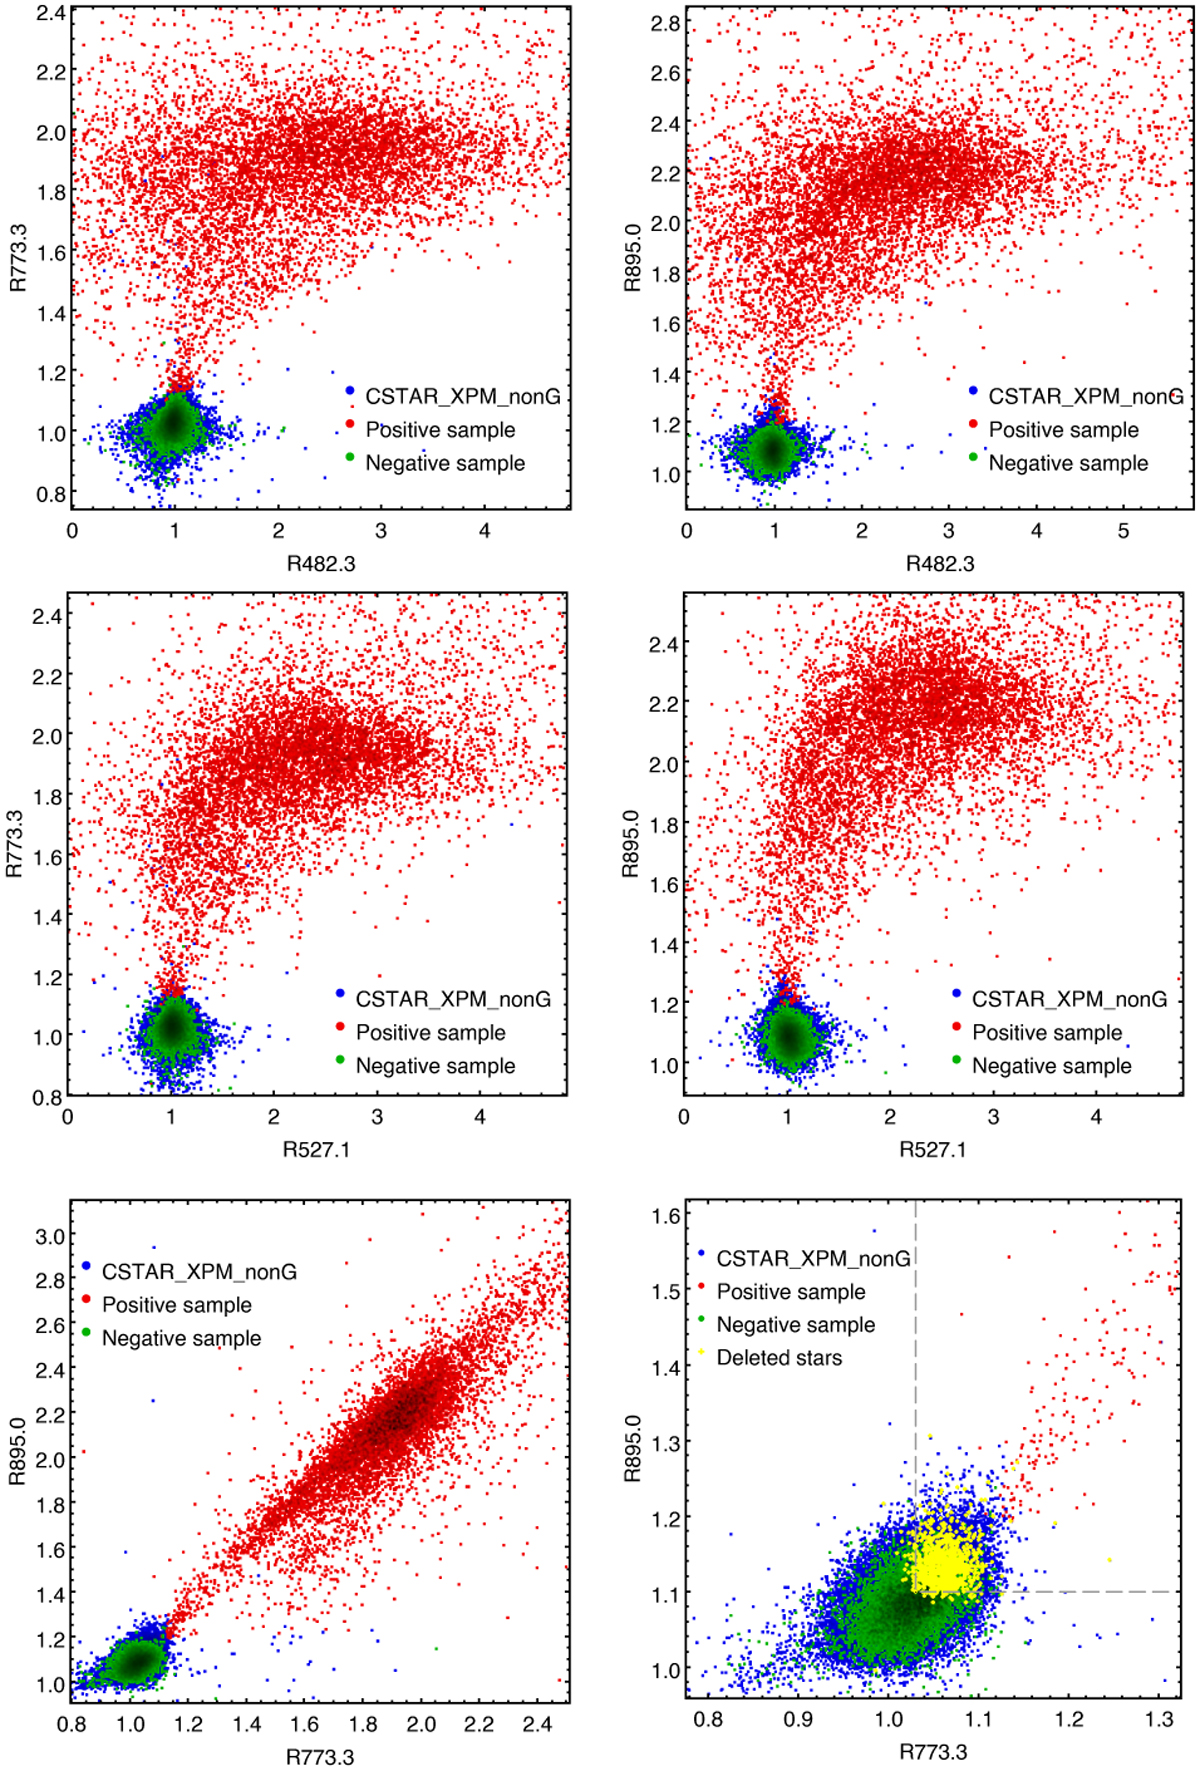
Fig. 4
Download original image
Alternative view from the C2023 sample of the 74 740 CSTAR_XPM_nonG (blue) flagged by ESP-ELS, 8176 selected positive training sample stars (red) from CSTAR_XPM_G, 8556 selected negative training sample stars (green) from CSTAR_XPM_nonG, and 885 deleted stars (yellow). The gray dashed line in the last subplot represents the boundary for the weakest CN strength.
Current usage metrics show cumulative count of Article Views (full-text article views including HTML views, PDF and ePub downloads, according to the available data) and Abstracts Views on Vision4Press platform.
Data correspond to usage on the plateform after 2015. The current usage metrics is available 48-96 hours after online publication and is updated daily on week days.
Initial download of the metrics may take a while.