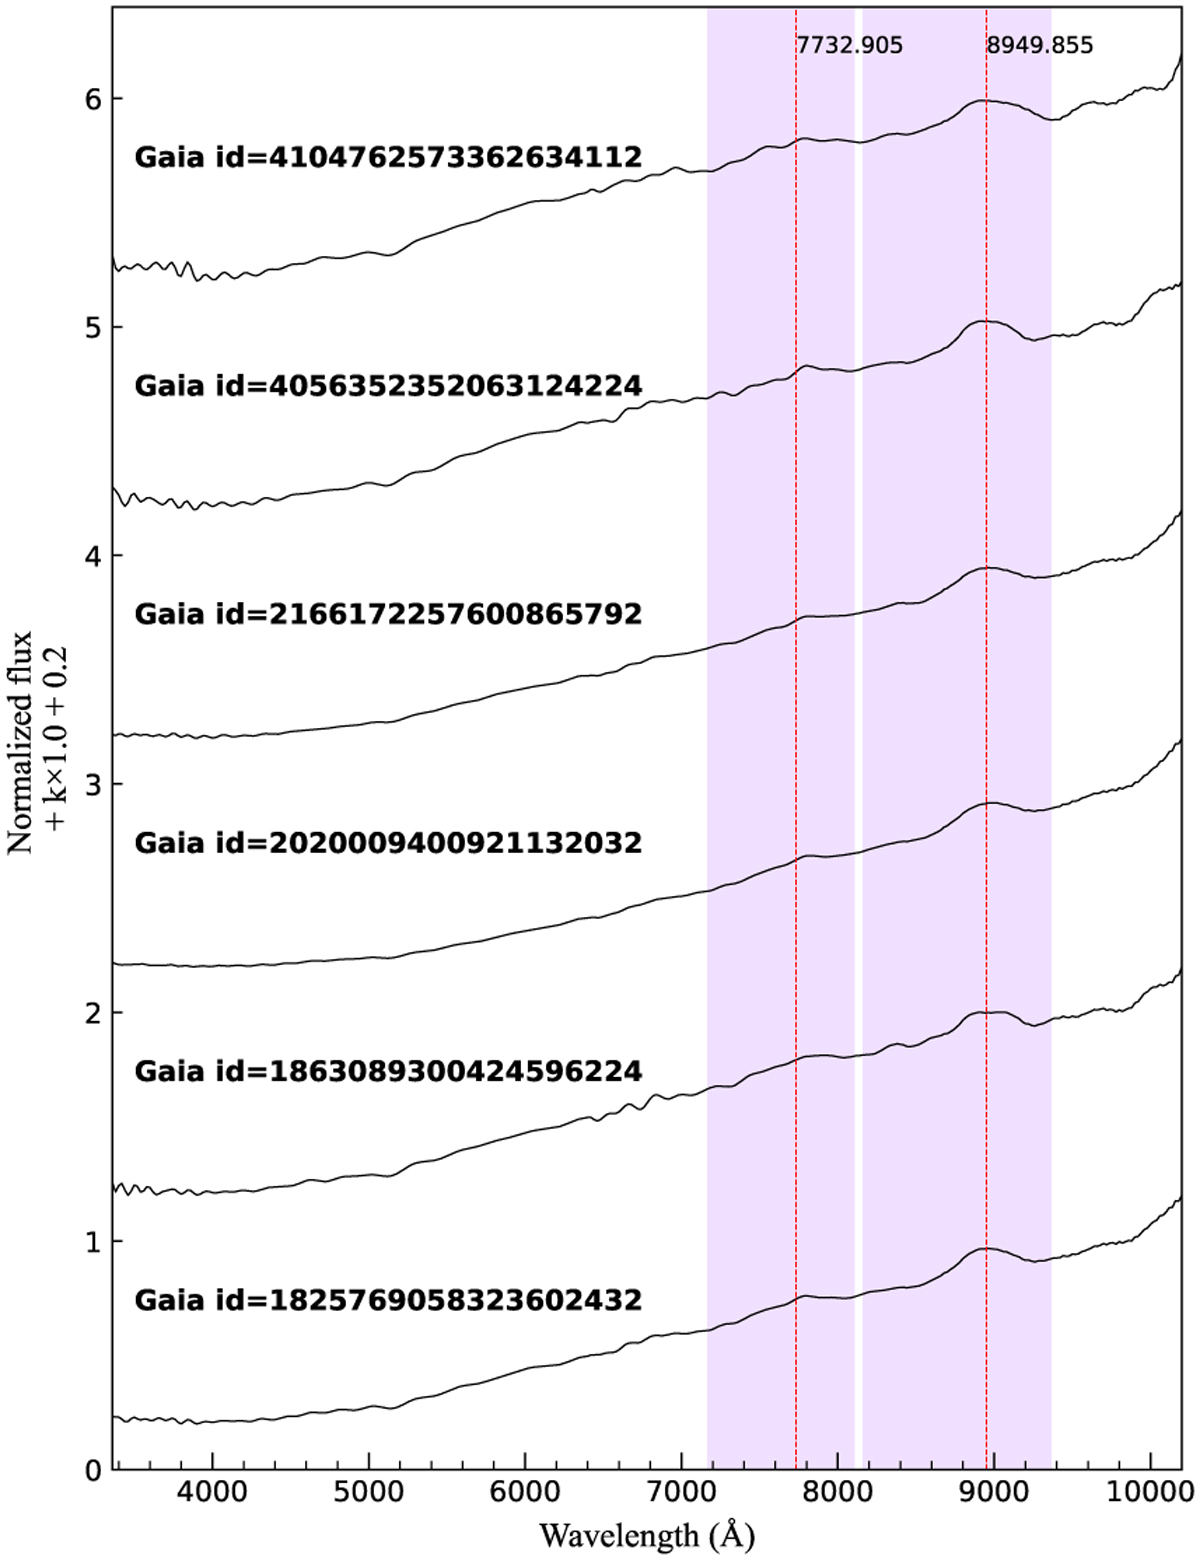
Fig. 3
Download original image
Six representative XP spectra from the 885 objects removed. The two prominent CN bands (purple areas) are located at the 7165–8108 Å and 8160–9367 Å ranges. The red dashed lines mark the top of the band head. The spectra are normalized and offset from one another by k × 1.0 + 0.2 for clarity (where k is an integer that varies from 0 to 6 from the bottom to the top spectrum).
Current usage metrics show cumulative count of Article Views (full-text article views including HTML views, PDF and ePub downloads, according to the available data) and Abstracts Views on Vision4Press platform.
Data correspond to usage on the plateform after 2015. The current usage metrics is available 48-96 hours after online publication and is updated daily on week days.
Initial download of the metrics may take a while.