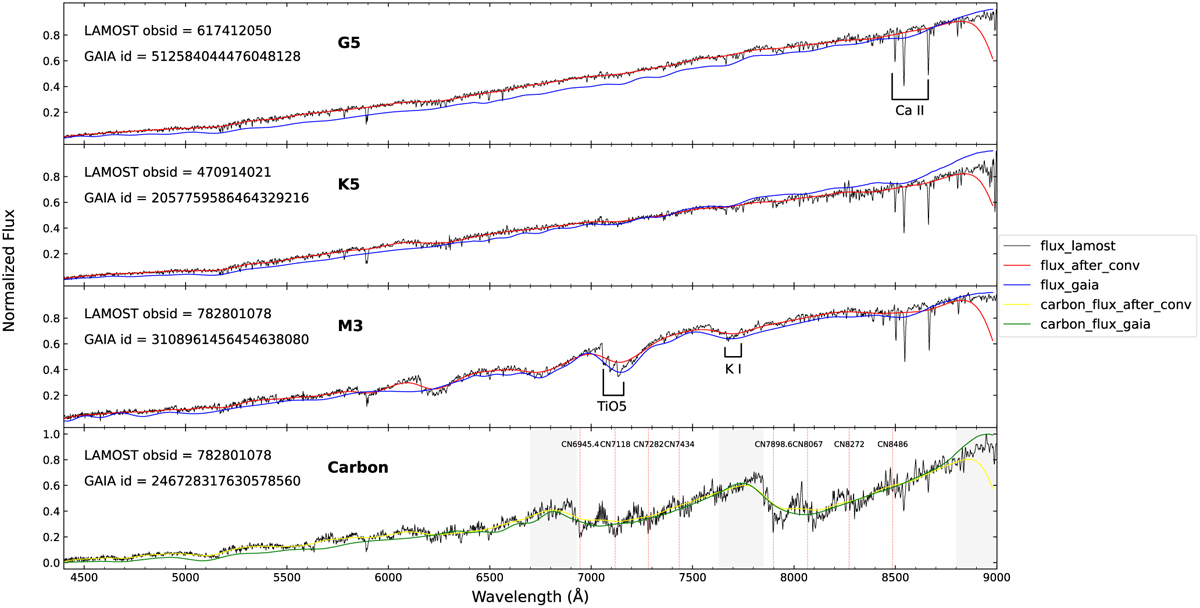
Fig. B.1
Download original image
Spectra with the wavelength range intercept to 4400–9000 Å. The LAMOST spectra of some common sources are plotted with black lines. The red and yellow lines are the result of their convolution to 50 resolution. The blue and green lines are the Gaia spectra. In the bottom panel, the light gray shaded areas pick out the peaks and the red dashed lines in the bottom panels mark several obvious CN absorption line locations.
Current usage metrics show cumulative count of Article Views (full-text article views including HTML views, PDF and ePub downloads, according to the available data) and Abstracts Views on Vision4Press platform.
Data correspond to usage on the plateform after 2015. The current usage metrics is available 48-96 hours after online publication and is updated daily on week days.
Initial download of the metrics may take a while.