Fig. 2
Download original image
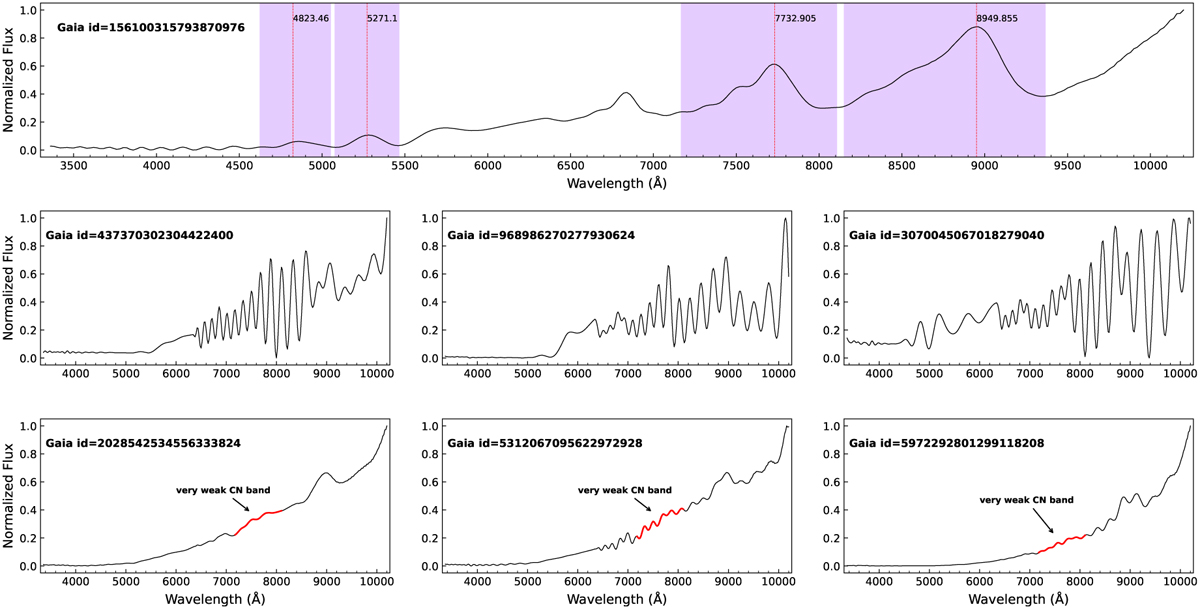
Images of normalized XP spectra of CSTAR_XPM_G. Upper panel shows a standard carbon star with four molecular band ranges marked in purple, and the red dotted line indicating the top of the band head. Middle panel shows three problematic spectra, while the bottom panel presents three spectra with very weak CN773.3 molecular band features.
Current usage metrics show cumulative count of Article Views (full-text article views including HTML views, PDF and ePub downloads, according to the available data) and Abstracts Views on Vision4Press platform.
Data correspond to usage on the plateform after 2015. The current usage metrics is available 48-96 hours after online publication and is updated daily on week days.
Initial download of the metrics may take a while.