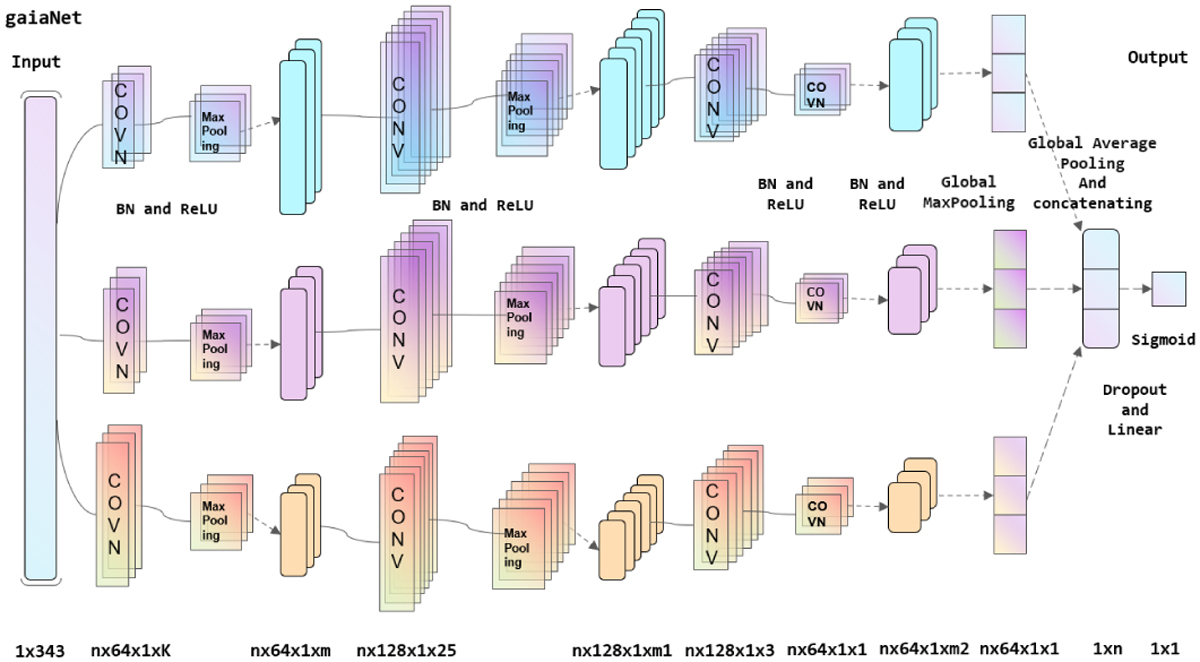
Fig. A.1
Download original image
Overall flowchart of GaiaNet. Convolution kernels of different sizes are used to extract features from different receptive field sizes. The arrows indicate the tensors of feature maps after convolution, pooling, or linear operations. A global max-pooling layer downsamples the feature map to compress its size and captures the most sensitive features. These are then combined into a tensor, which then undergoes GAP to share each feature value across the entire feature map. The resulting tensor is passed through a fully connected layer, which summarizes the features to produce a high-level abstract representation. Finally, a Sigmoid layer converts the neural network’s output into a probability distribution, making the predictions easier to interpret. Below the diagram, the corresponding convolution, pooling, and feature map shapes are labeled.
Current usage metrics show cumulative count of Article Views (full-text article views including HTML views, PDF and ePub downloads, according to the available data) and Abstracts Views on Vision4Press platform.
Data correspond to usage on the plateform after 2015. The current usage metrics is available 48-96 hours after online publication and is updated daily on week days.
Initial download of the metrics may take a while.