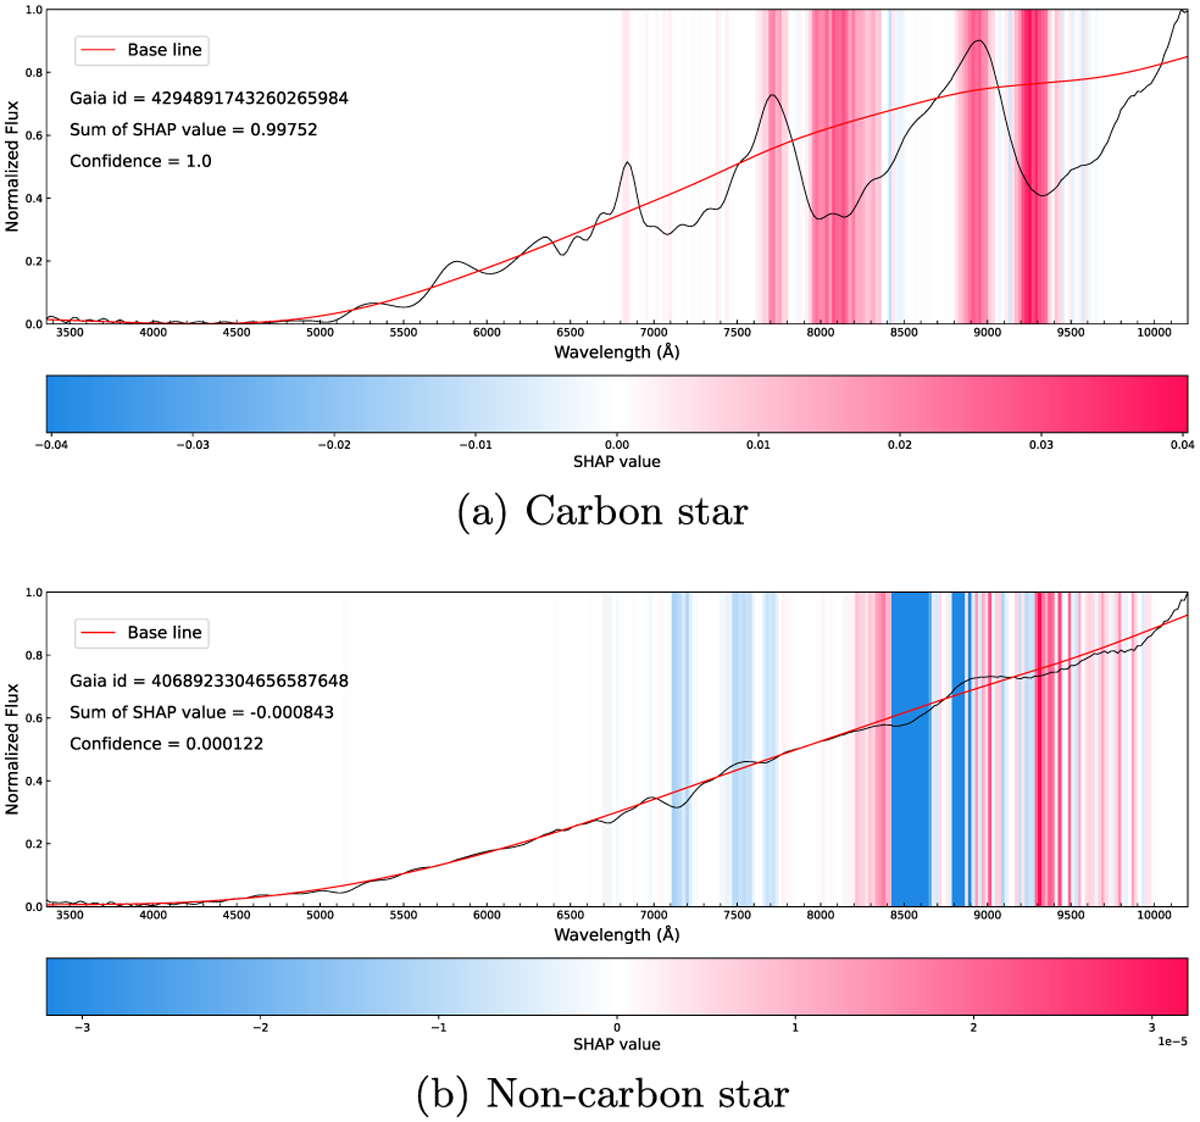
Fig. 11
Download original image
Feature heatmaps for individual spectral interpretations. The baseline is a background pseudo-continuum used to compute SHAP values, highlighting spectral features. The color indicates the SHAP value size: redder features contribute positively, while bluer ones contribute negatively to the model’s interpretation of carbon stars. The sum of SHAP values approximates the model output, with a larger sum indicating a stronger likelihood of the spectrum being identified as a carbon star.
Current usage metrics show cumulative count of Article Views (full-text article views including HTML views, PDF and ePub downloads, according to the available data) and Abstracts Views on Vision4Press platform.
Data correspond to usage on the plateform after 2015. The current usage metrics is available 48-96 hours after online publication and is updated daily on week days.
Initial download of the metrics may take a while.