Fig. 10
Download original image
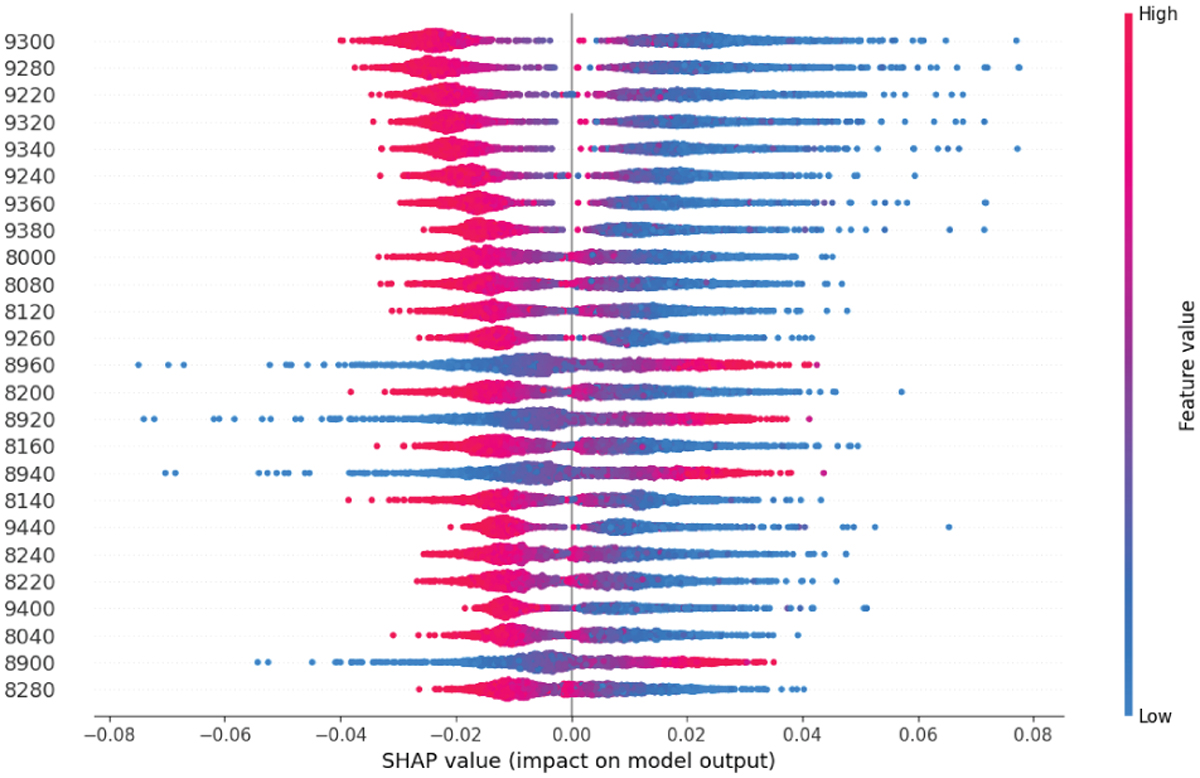
Contribution ranking of features to the model result based on SHAP values. Each point represents a feature from the spectrum. The horizontal axis shows the SHAP values, while the vertical axis ranks the top 30 spectral features for identifying carbon stars, from most to least important. The color of each point indicates the size of the feature value.
Current usage metrics show cumulative count of Article Views (full-text article views including HTML views, PDF and ePub downloads, according to the available data) and Abstracts Views on Vision4Press platform.
Data correspond to usage on the plateform after 2015. The current usage metrics is available 48-96 hours after online publication and is updated daily on week days.
Initial download of the metrics may take a while.