Fig. 9.
Download original image
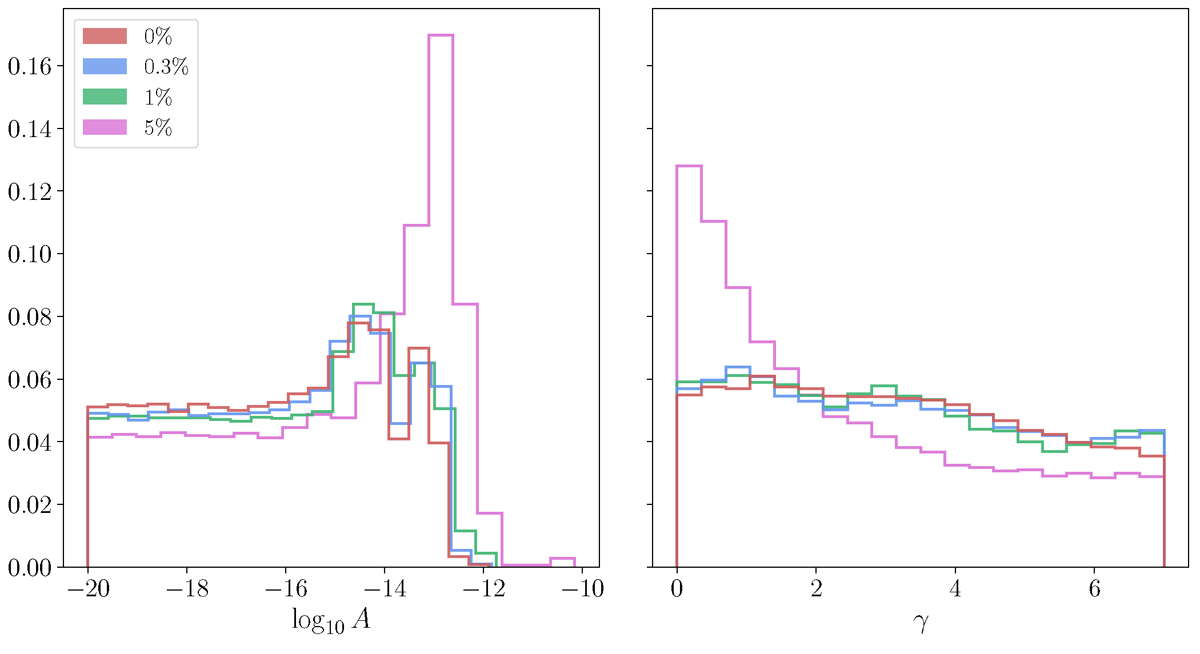
The cumulative marginalized posterior distributions of the amplitudes (left) and the spectral indices (right) of the DM-induced noise specific for each pulsar for the dataset MultiF corrupted with 0% (red), 0.3% (blue), 1% (green), 5% (pink) of outliers. The histograms, in each panel, are the sum of the normalized marginalized posteriors of the amplitudes and the spectral indices of the DM-induced noises of the pulsars. As done in Figures 5, 8, the distributions for the data corrupted with 10% of outliers are not reported.
Current usage metrics show cumulative count of Article Views (full-text article views including HTML views, PDF and ePub downloads, according to the available data) and Abstracts Views on Vision4Press platform.
Data correspond to usage on the plateform after 2015. The current usage metrics is available 48-96 hours after online publication and is updated daily on week days.
Initial download of the metrics may take a while.