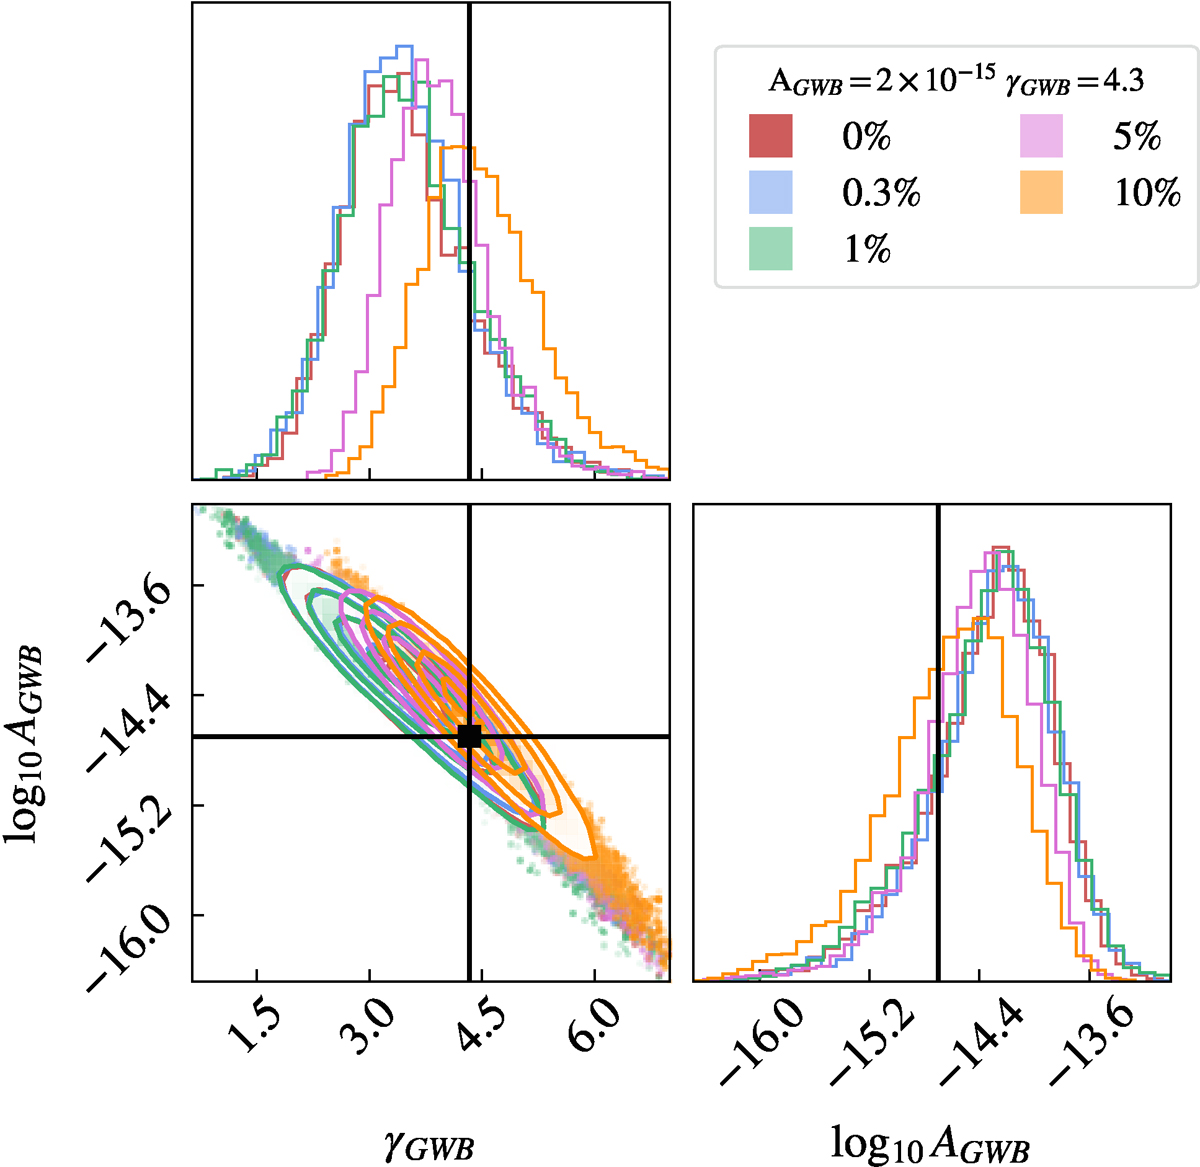
Fig. 3.
Download original image
Two-dimensional marginalized posterior distributions of log10AGWB and γGWB recovered for the OneF dataset corrupted with 0% (red), 0.3% (blue), 1% (green), 5% (pink) and 10% (orange) of outliers. Each pair of distributions (log10AGW; γGW) has been recovered separately and then overlapped to be easily compared. The black lines and the square indicate the injected values of the amplitude and spectral index.
Current usage metrics show cumulative count of Article Views (full-text article views including HTML views, PDF and ePub downloads, according to the available data) and Abstracts Views on Vision4Press platform.
Data correspond to usage on the plateform after 2015. The current usage metrics is available 48-96 hours after online publication and is updated daily on week days.
Initial download of the metrics may take a while.