Fig. 10.
Download original image
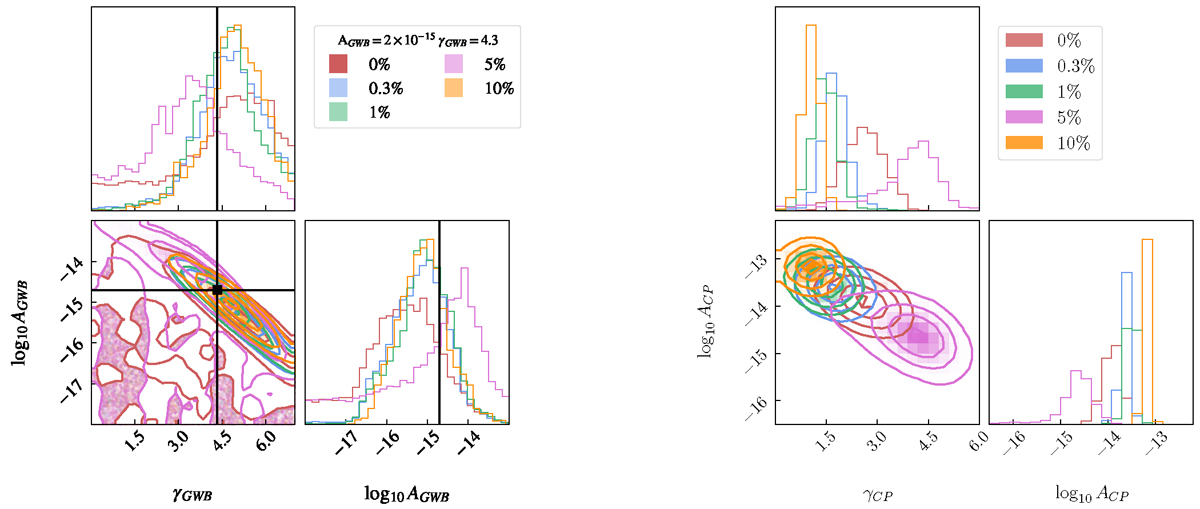
Recovered common processes searched in the OneF dataset corrupted with 0% (red), 0.3% (blue), 1% (green), 5% (pink) and 10% (orange) of outliers. Left: two-dimensional posterior probabilities of the parameters characterizing the GWB (AGWB,γGWB). The injected values (2 × 10⁻¹⁵, 4.3) are represented by black lines and a square symbol. Notably, in this case, the signal can consistently be accurately recovered. Right: two-dimensional posterior probabilities of the parameters characterizing the CP (ACP,γCP). Unlike the GWB, this signal was not directly injected into the data.
Current usage metrics show cumulative count of Article Views (full-text article views including HTML views, PDF and ePub downloads, according to the available data) and Abstracts Views on Vision4Press platform.
Data correspond to usage on the plateform after 2015. The current usage metrics is available 48-96 hours after online publication and is updated daily on week days.
Initial download of the metrics may take a while.