Fig. 1.
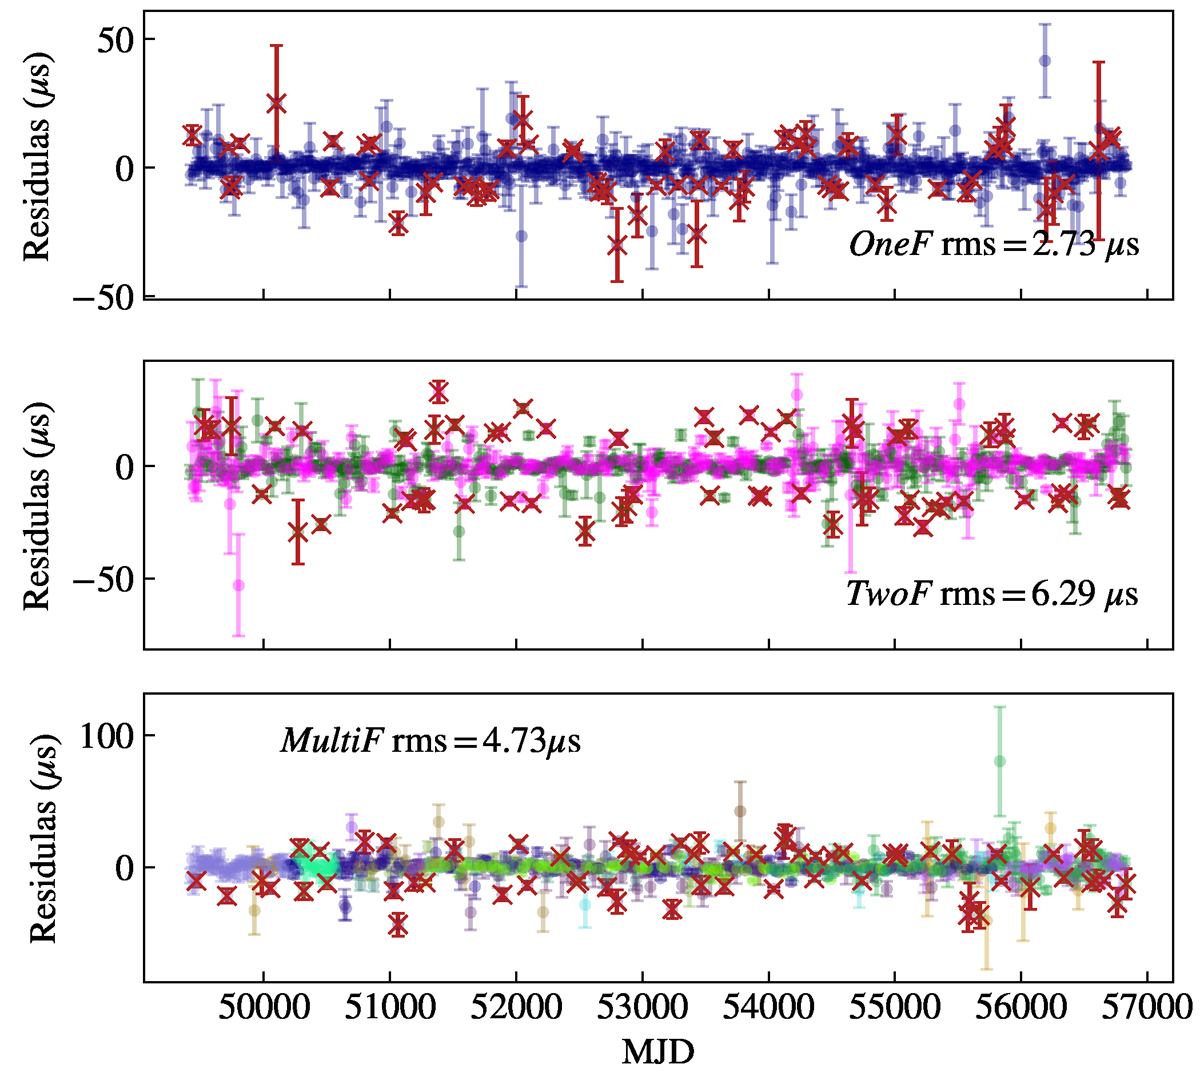
Download original image
Simulated timing residuals (colored circles) of PSR J1730−2304 with 10% of outliers injected (red crosses). The different colors of the timing residuals represent the systems responsible for the observations. The top plot represents the timing residuals simulated for the OneF dataset, for which we employ a single system/observation frequency for all the observations. In the central plot, we show those for the TwoF dataset for which we employ two systems/observation frequencies, and the bottom plot those for the MultiF dataset for which we consider several systems/observation frequencies.
Current usage metrics show cumulative count of Article Views (full-text article views including HTML views, PDF and ePub downloads, according to the available data) and Abstracts Views on Vision4Press platform.
Data correspond to usage on the plateform after 2015. The current usage metrics is available 48-96 hours after online publication and is updated daily on week days.
Initial download of the metrics may take a while.