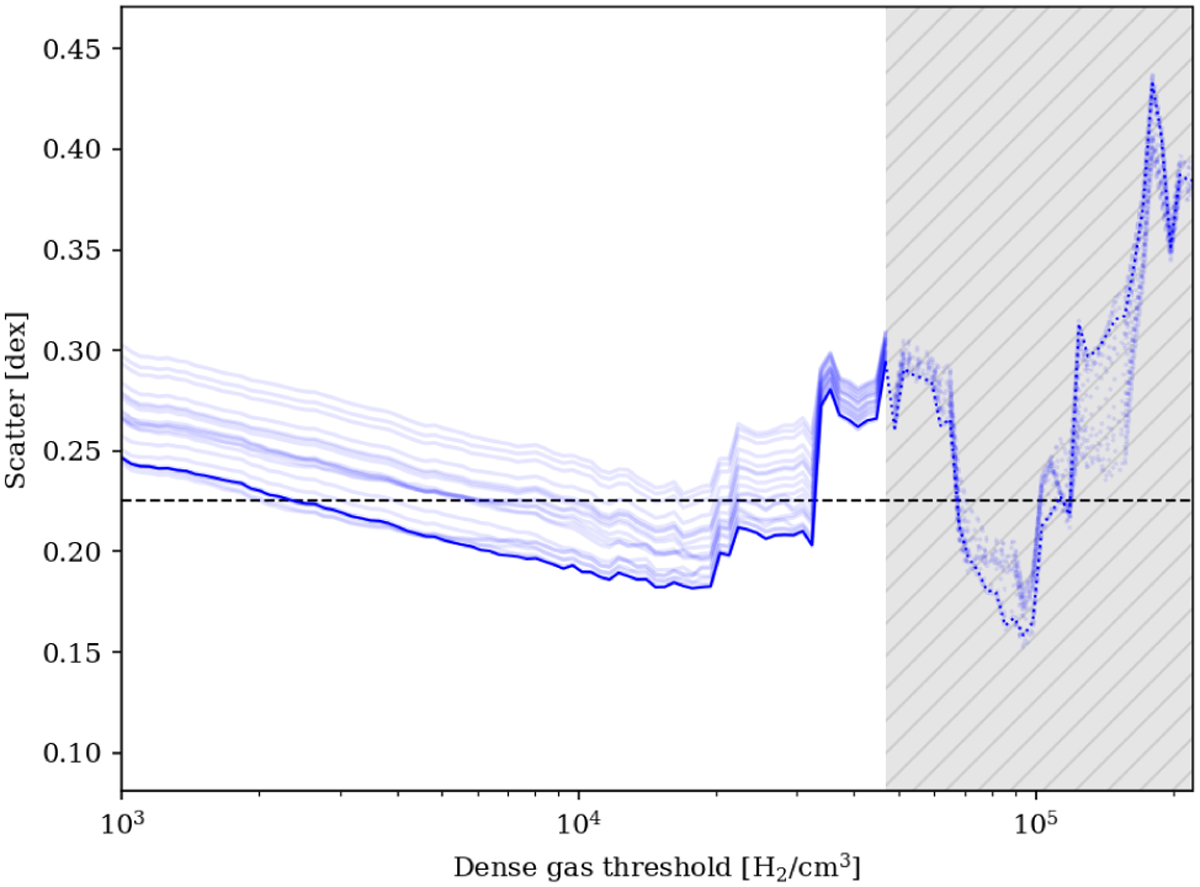
Fig. 7
Download original image
Determination of the volume density thresholds yielding the tightest correlation between the volume density and star formation. Each transparent blue line corresponds to a different value of the low-density threshold between 10 H2 cm−3 and 5 × 10² H2 cm−3, the solid blue plot corresponds to the optimal threshold of 2 × 10² H2 cm−3. The dashed horizontal line at 0.225 dex corresponds to the spread obtained when using column densities. Values for a dense gas threshold higher than 5 × 10⁴ H2 cm−3 (shaded area) are not considered because not all clouds in the sample reach such high values and the statistics thus become less and less reliable.
Current usage metrics show cumulative count of Article Views (full-text article views including HTML views, PDF and ePub downloads, according to the available data) and Abstracts Views on Vision4Press platform.
Data correspond to usage on the plateform after 2015. The current usage metrics is available 48-96 hours after online publication and is updated daily on week days.
Initial download of the metrics may take a while.