Fig. 5
Download original image
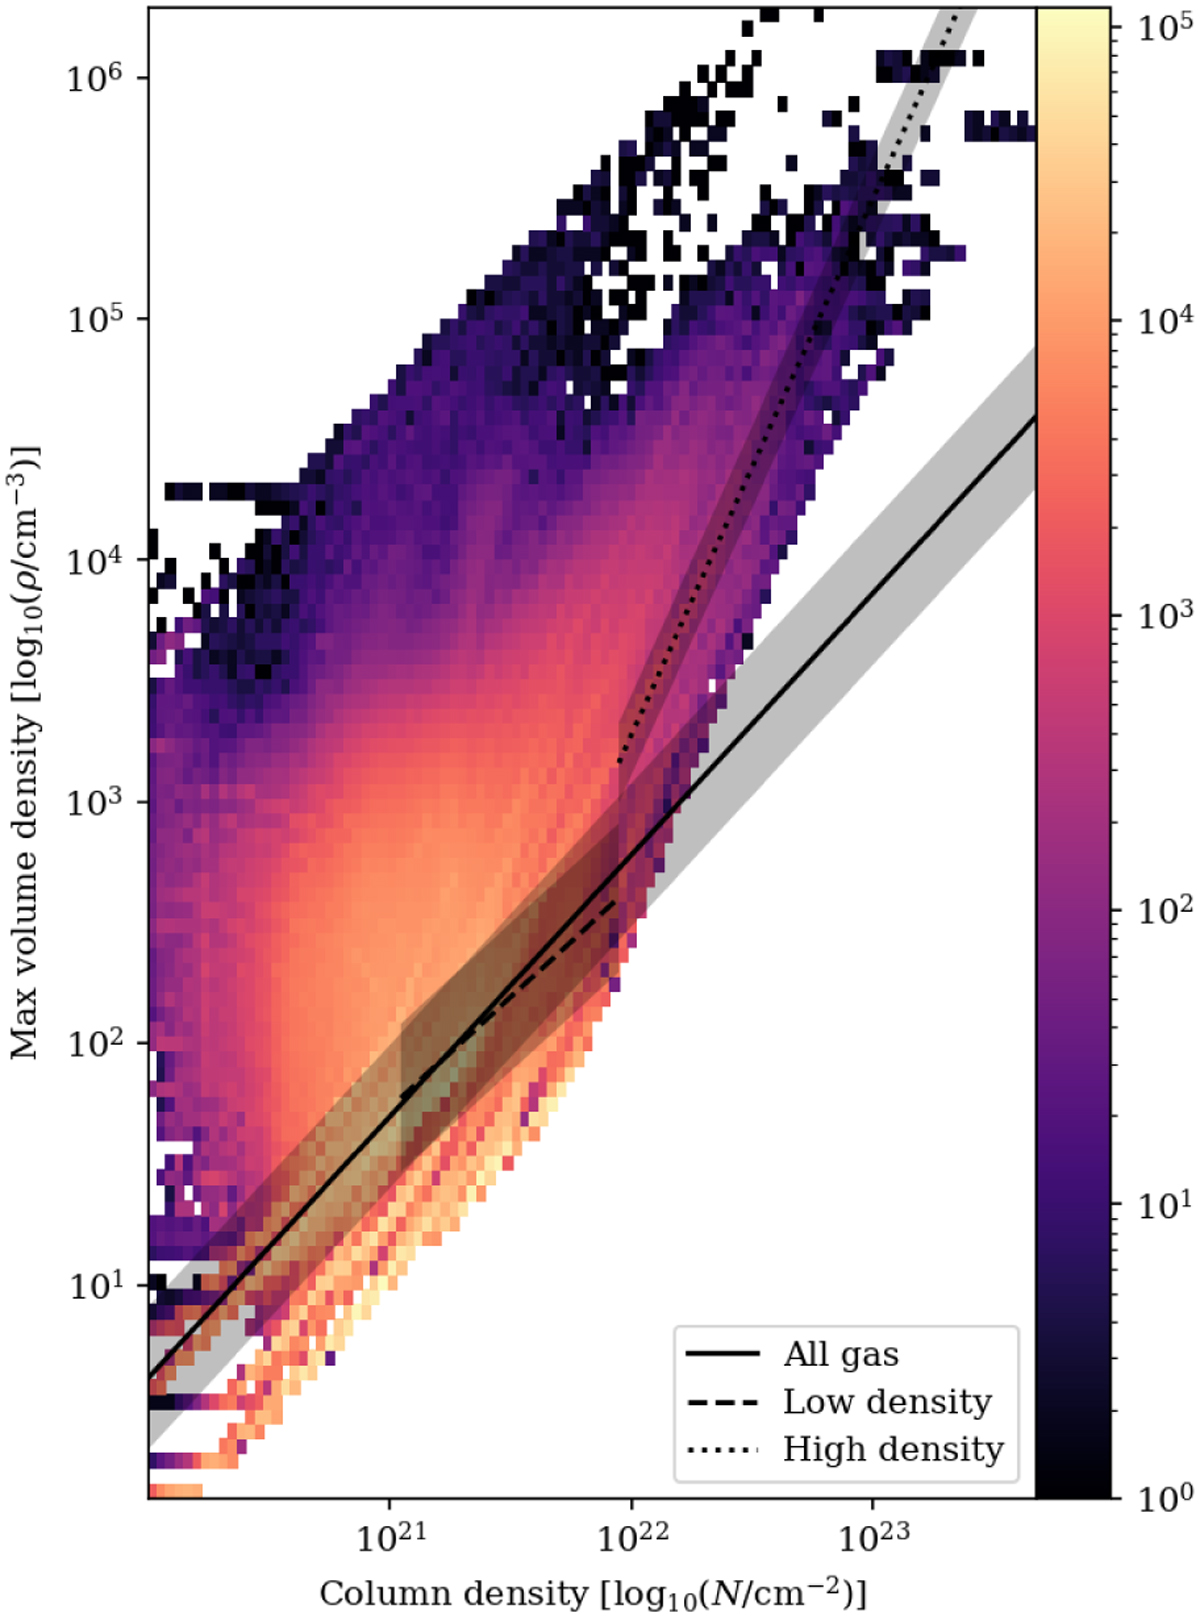
Joint distribution of the column density and peak volume density, for all the lines of sight of all the clouds in the sample. The trend of this distribution has been fitted as a power law in three column density regimes: for the entire column density range present in the data (solid line), for the low-density molecular gas defined as AV = 1–8 mag (dashed line), and for the dense gas defined as AV > 8 mag (dotted line). The RMS scatter around the best fit relation is represented by the shaded areas.
Current usage metrics show cumulative count of Article Views (full-text article views including HTML views, PDF and ePub downloads, according to the available data) and Abstracts Views on Vision4Press platform.
Data correspond to usage on the plateform after 2015. The current usage metrics is available 48-96 hours after online publication and is updated daily on week days.
Initial download of the metrics may take a while.