Fig. 4
Download original image
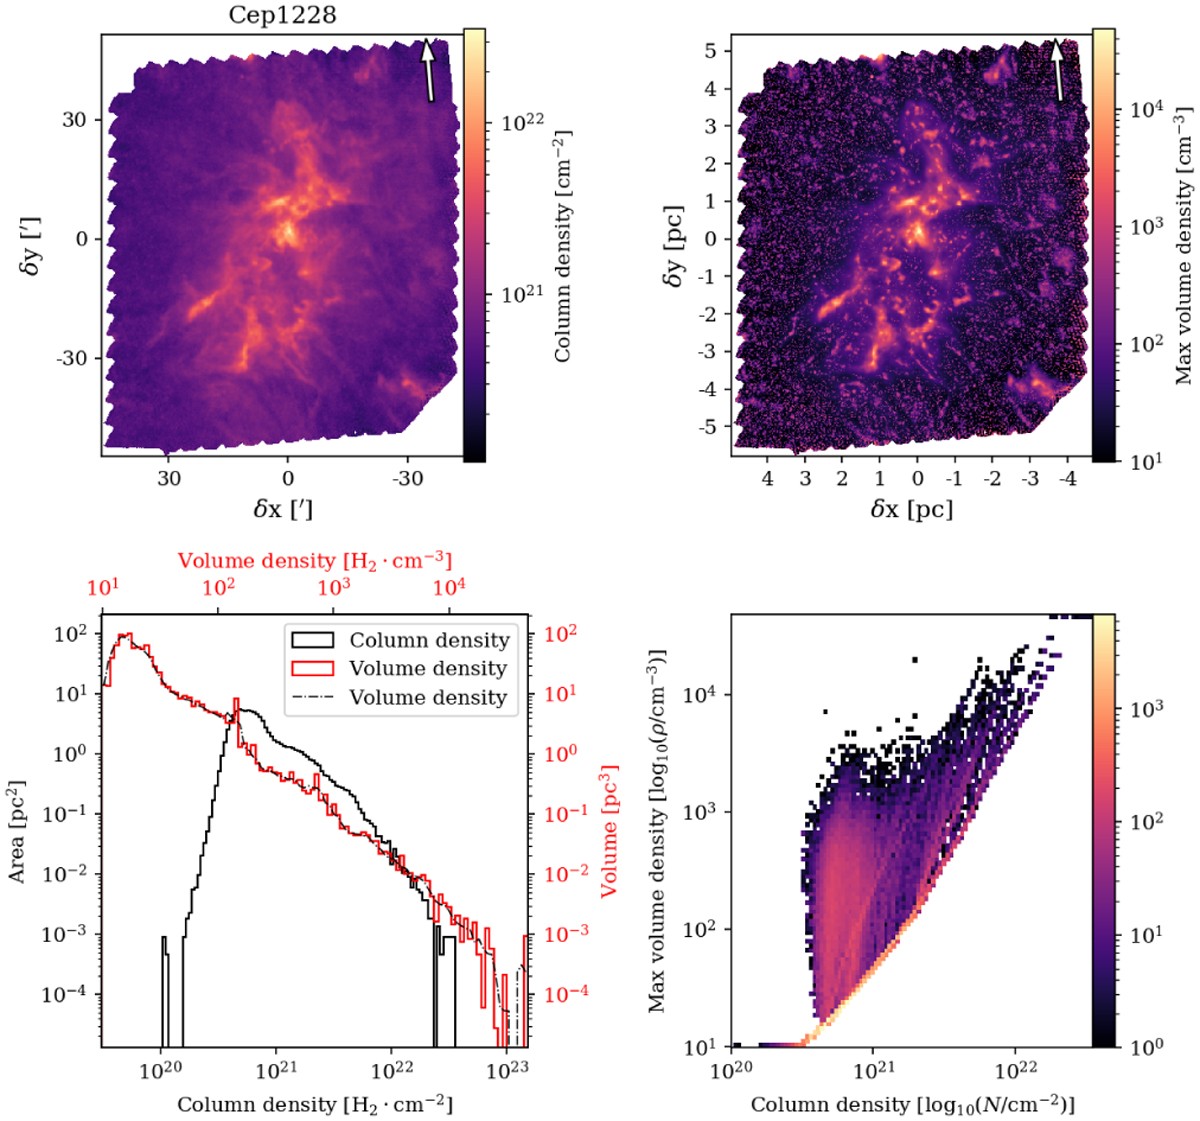
Main products of the Colume volume density estimation for the Cep 1228 molecular cloud. The same figures for all clouds in our sample are shown in the supplementary online material. Top left: column density map obtained from HGBS data, the arrow indicates north. Top right: map of the peak volume density (maximum volume density reached along a line of sight). Bottom left: comparison of the column density PDF (solid black) and reconstructed volume density PDF (solid red) for the entire cloud. The dash-dotted line corresponds to the smoothed volume density PDF used to determine the volume density contrast. The data ranges are different, but the scaling is the same for the column and volume density case. Bottom right: joint distribution of the column density and peak volume density for each line of sight.
Current usage metrics show cumulative count of Article Views (full-text article views including HTML views, PDF and ePub downloads, according to the available data) and Abstracts Views on Vision4Press platform.
Data correspond to usage on the plateform after 2015. The current usage metrics is available 48-96 hours after online publication and is updated daily on week days.
Initial download of the metrics may take a while.