Fig. 3
Download original image
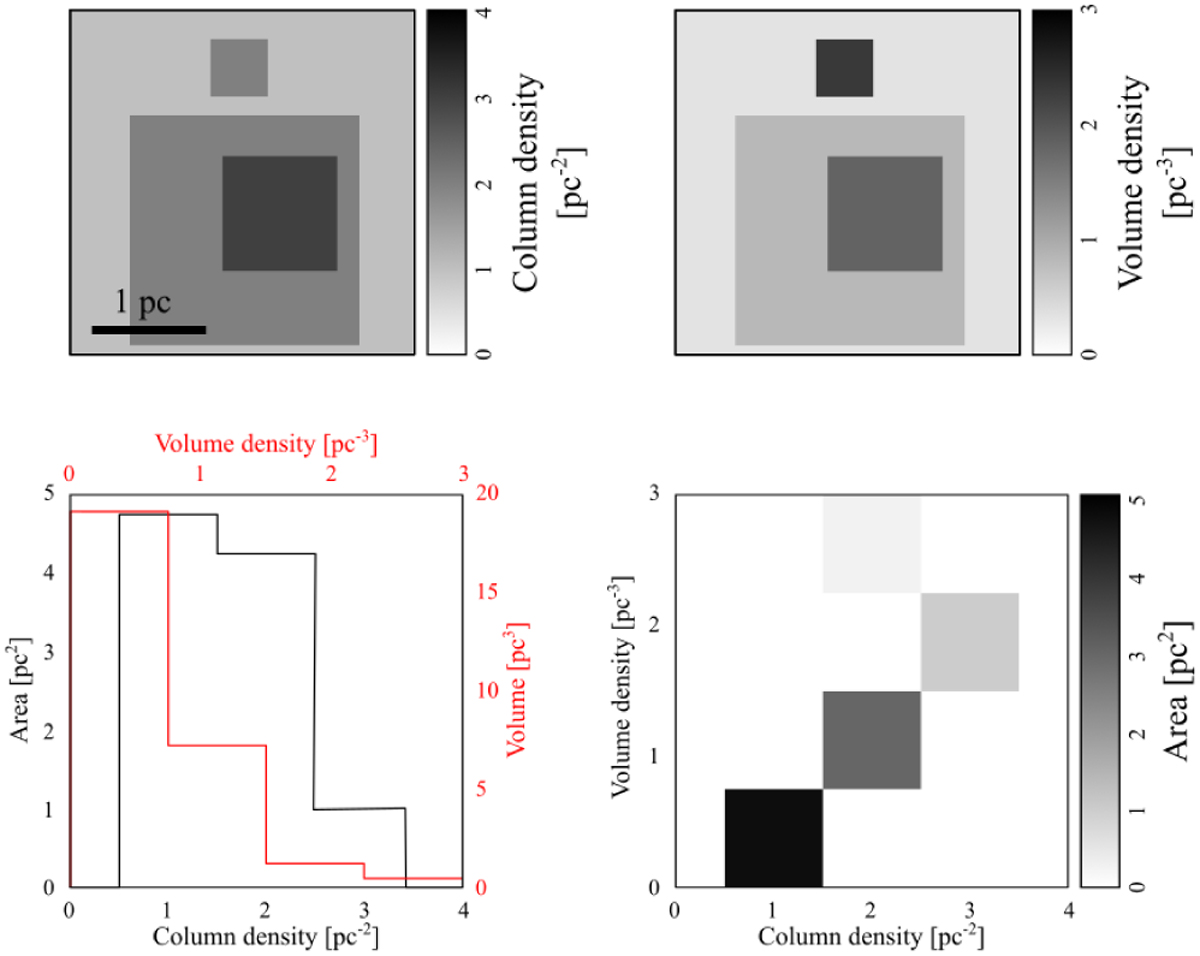
Main products of the Colume volume density estimation (similar to Fig. 4) obtained for the simple example illustrated in Fig. 1. Top left: original column density data. Top right: peak volume density reached along each line of sight. Bottom left: comparison of the column density (black) and volume density (red) histograms for the entire area (respectively volume) of the cloud. Bottom right: joint distribution of the column density and peak volume density.
Current usage metrics show cumulative count of Article Views (full-text article views including HTML views, PDF and ePub downloads, according to the available data) and Abstracts Views on Vision4Press platform.
Data correspond to usage on the plateform after 2015. The current usage metrics is available 48-96 hours after online publication and is updated daily on week days.
Initial download of the metrics may take a while.