Fig. C.5
Download original image
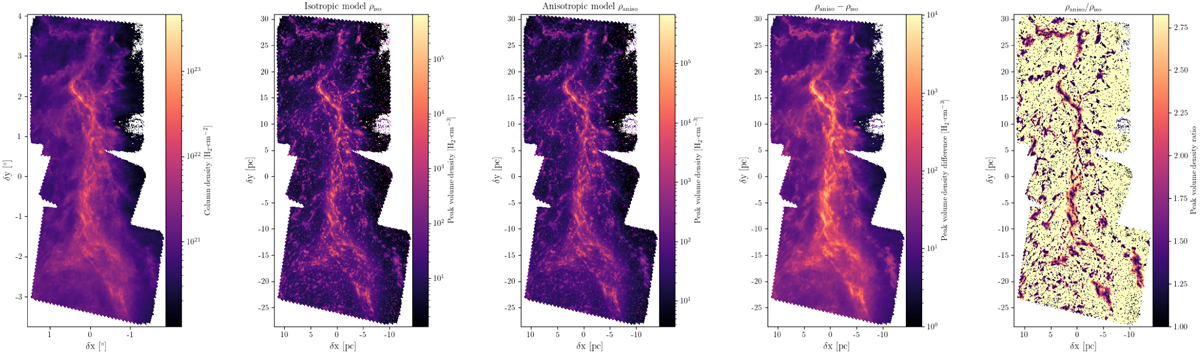
Comparison of the effect of scale-dependent anisotropy on density maps. From left to right: Column density map used as a prior; peak volume density map obtained with the isotropic model; peak volume density map obtained with the anisotropic model; difference between the two peak volume density maps; ratio between the two peak volume density maps.
Current usage metrics show cumulative count of Article Views (full-text article views including HTML views, PDF and ePub downloads, according to the available data) and Abstracts Views on Vision4Press platform.
Data correspond to usage on the plateform after 2015. The current usage metrics is available 48-96 hours after online publication and is updated daily on week days.
Initial download of the metrics may take a while.