Fig. 2
Download original image
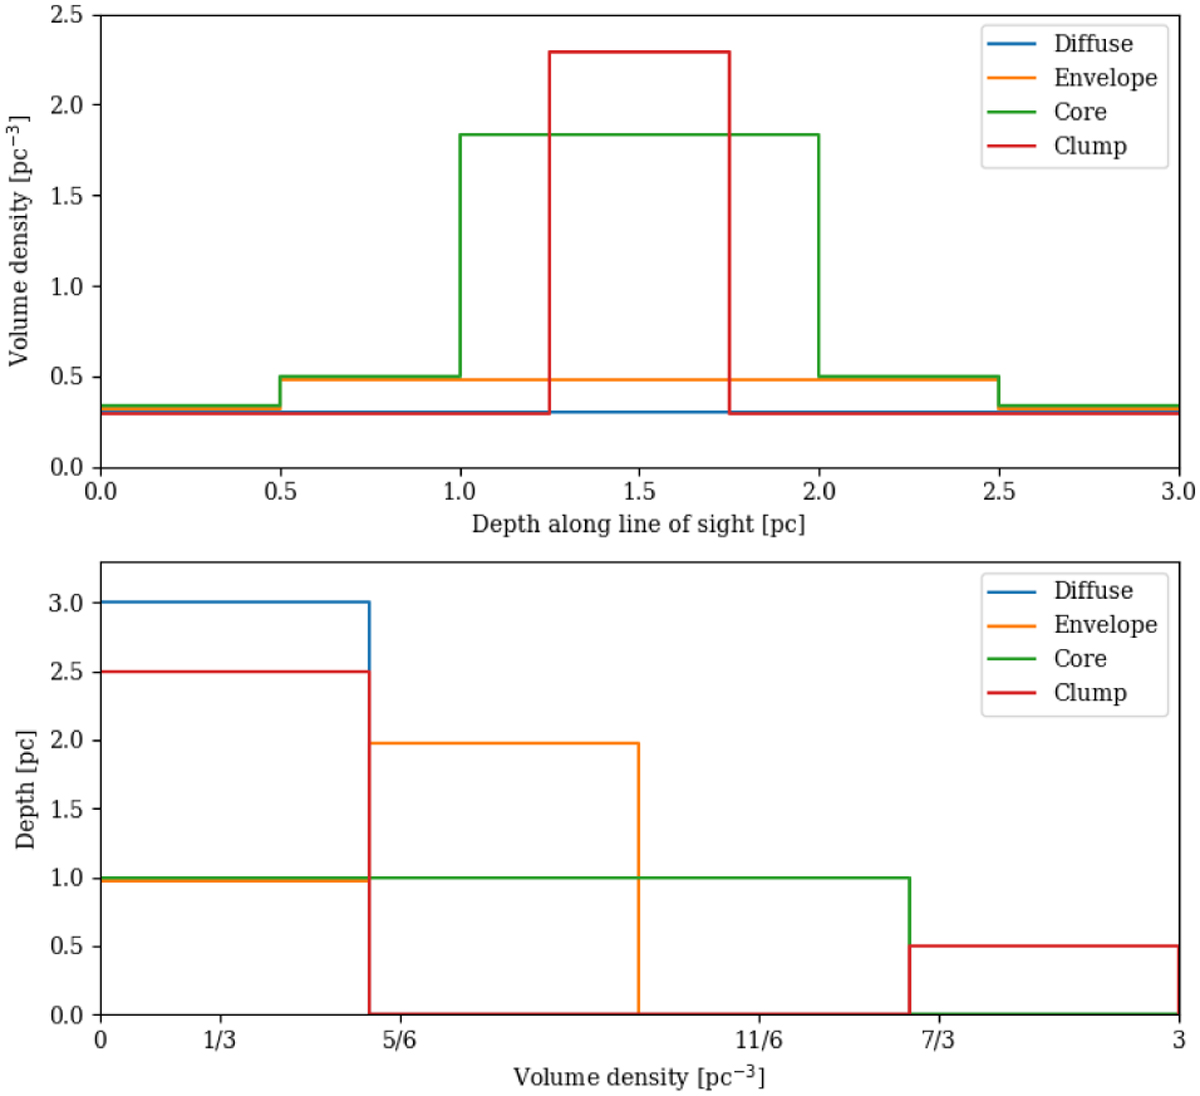
Different representations of the volume densities reconstructed for the simple example illustrated in Fig. 1. Top: density profile along lines of sight corresponding to the different environments in the map (diffuse background, intermediate density envelope, dense core, small isolated clump). The nested dense structures are represented in the mid-plane along the line of sight only by convention. Bottom: PDFs of volume densities along the line of sight corresponding to the above lines of sight. The densities are expressed in the same arbitrary units as in Fig. 1. The statistical weights are equivalent to depths along the line of sight, as represented in the top panel.
Current usage metrics show cumulative count of Article Views (full-text article views including HTML views, PDF and ePub downloads, according to the available data) and Abstracts Views on Vision4Press platform.
Data correspond to usage on the plateform after 2015. The current usage metrics is available 48-96 hours after online publication and is updated daily on week days.
Initial download of the metrics may take a while.