Open Access
Fig. B.3
Download original image
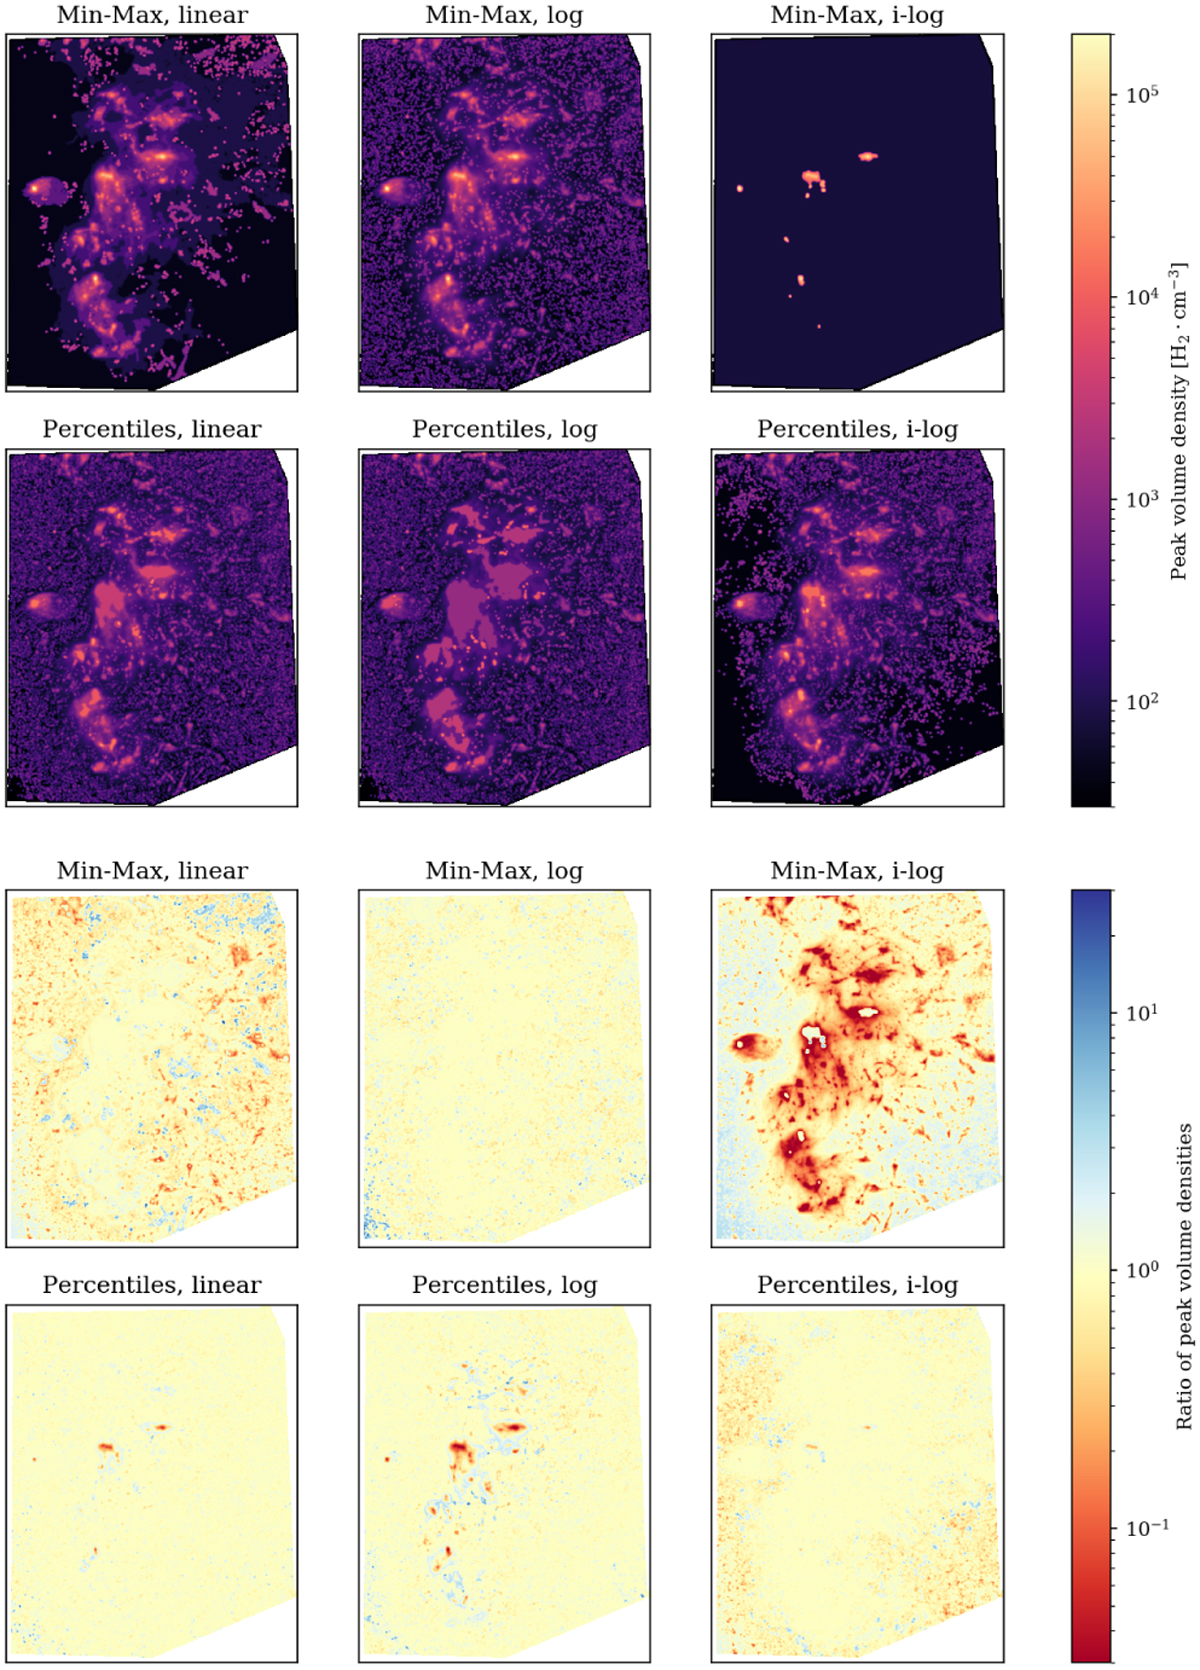
Effects of sampling options on the peak volume density maps, for the Cha II cloud. Top: Peak volume density maps obtained with different coarse, 50-level volume density reconstructions. Bottom: Ratio of these maps to the reference peak volume density map (obtained with a 2000-level i-log percentile sampling).
Current usage metrics show cumulative count of Article Views (full-text article views including HTML views, PDF and ePub downloads, according to the available data) and Abstracts Views on Vision4Press platform.
Data correspond to usage on the plateform after 2015. The current usage metrics is available 48-96 hours after online publication and is updated daily on week days.
Initial download of the metrics may take a while.