Fig. A.2
Download original image
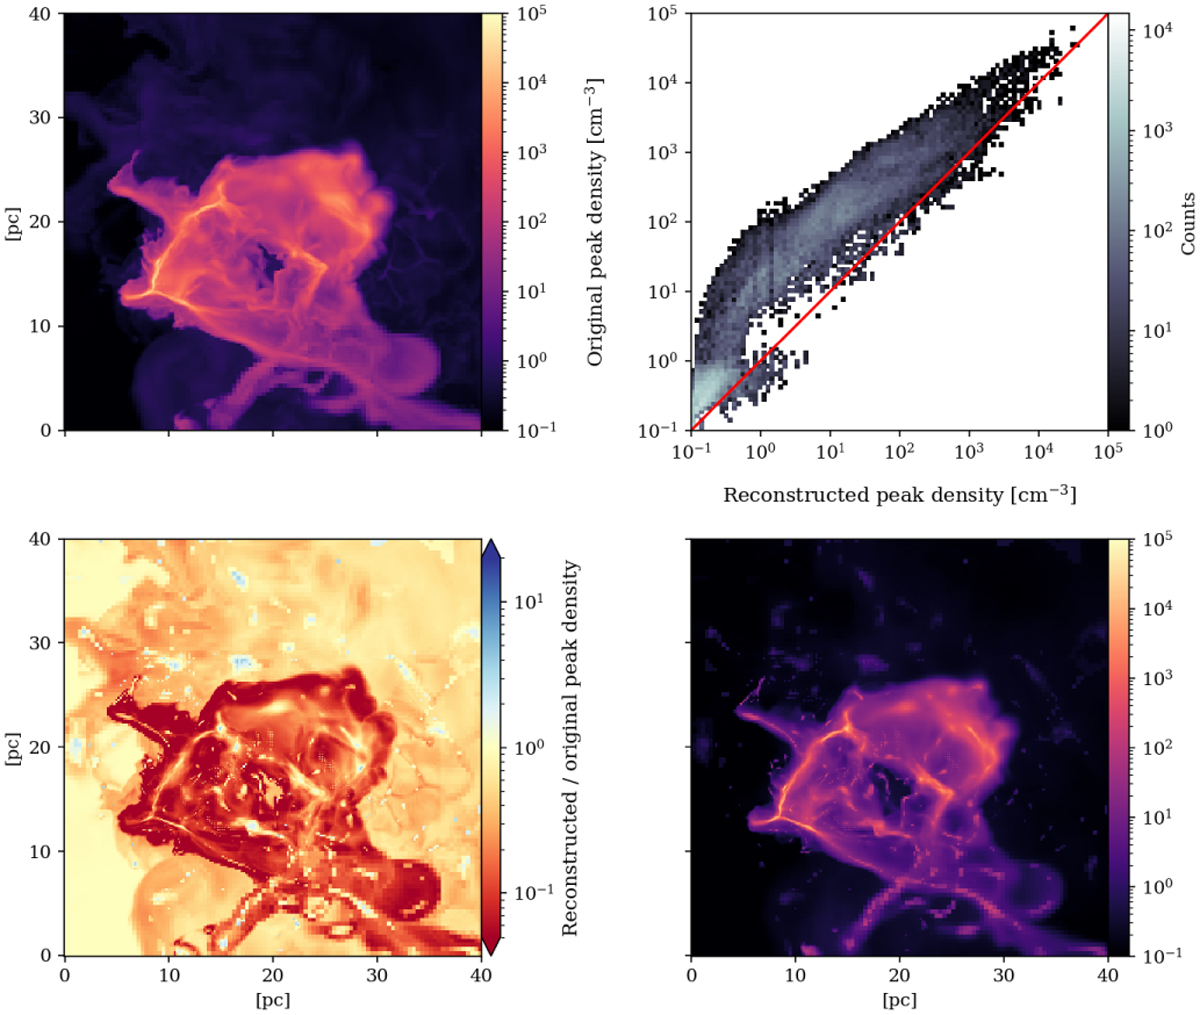
Estimation of the peak volume density along the line of sight from a noiseless column density map. Top left: Original noiseless data. Top right: Joint histogram of the original vs. reconstructed peak volume densities. Bottom left: Map of the ratio of reconstructed-to-original peak volume densities. Bottom right: Reconstructed map of peak volume densities along the line of sight.
Current usage metrics show cumulative count of Article Views (full-text article views including HTML views, PDF and ePub downloads, according to the available data) and Abstracts Views on Vision4Press platform.
Data correspond to usage on the plateform after 2015. The current usage metrics is available 48-96 hours after online publication and is updated daily on week days.
Initial download of the metrics may take a while.