Fig. 1
Download original image
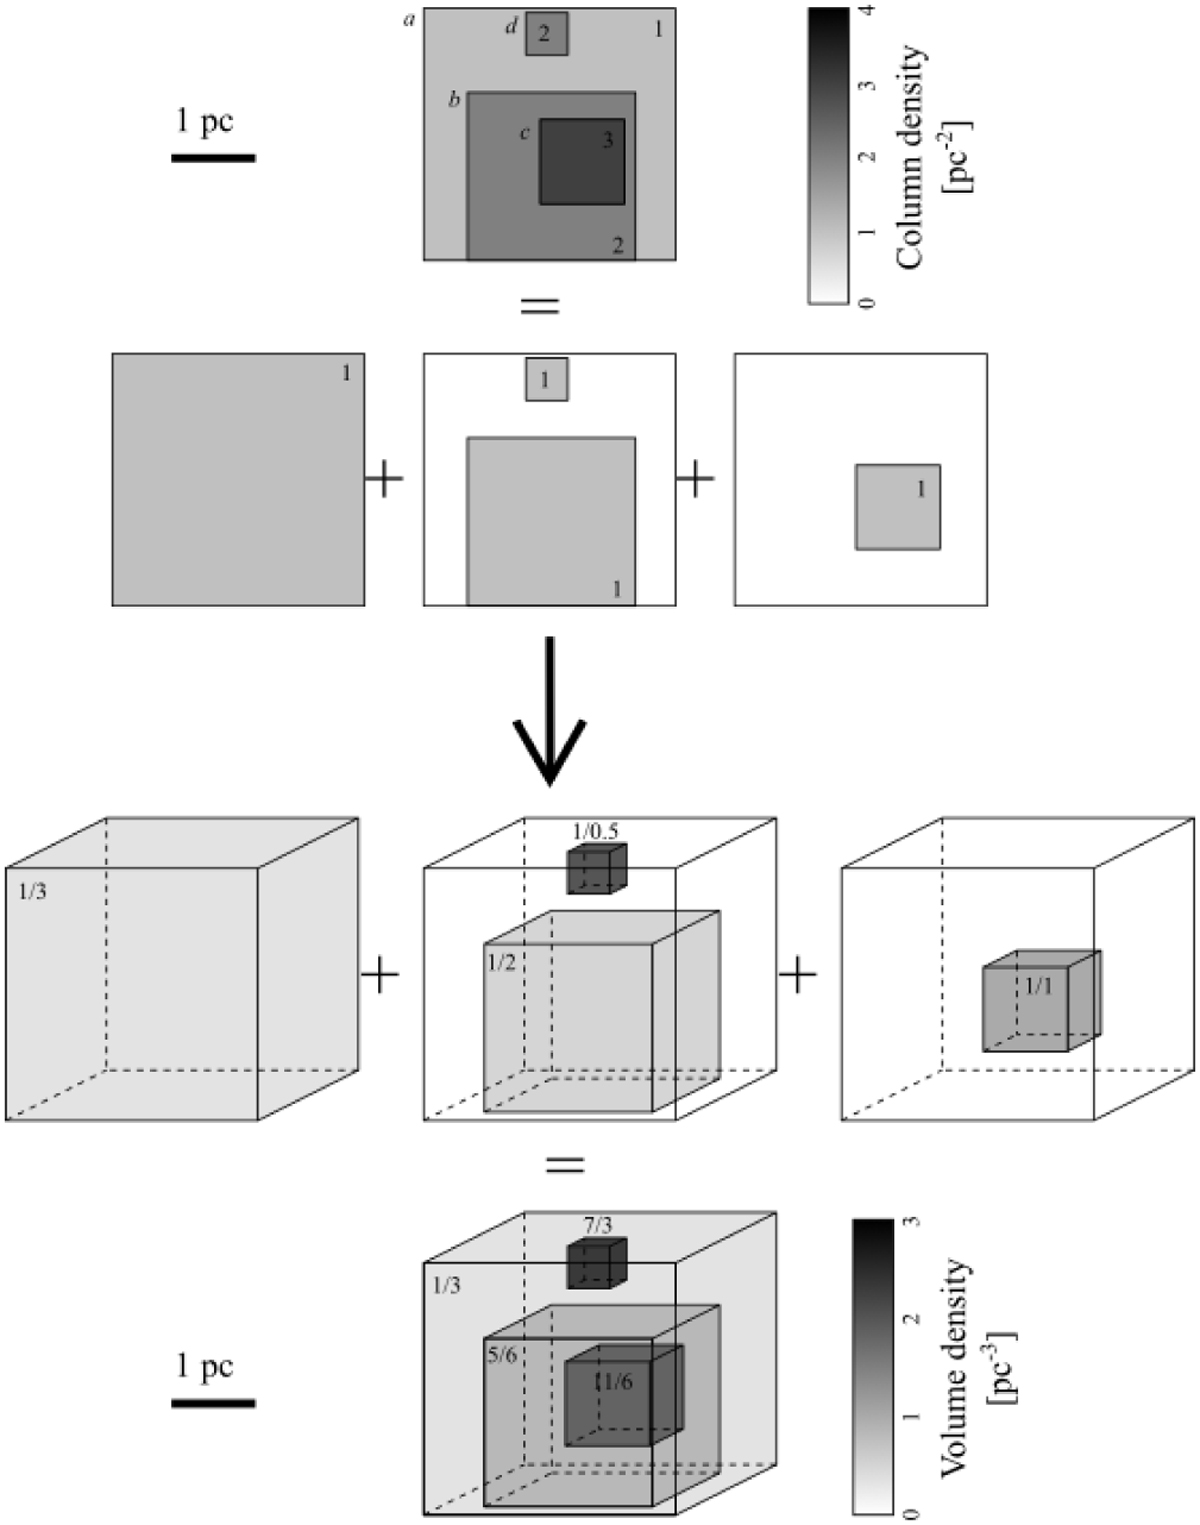
Schematic representation of the volume density estimation. The indicated numbers correspond to the column (respectively volume) density values, in arbitrary units. Top half: original column density map with contours that define the following structures: a 9 pc2 diffuse background a, a main cloud with a 4 pc2 intermediate density envelope b and a 1 pc2 dense core c, and a small isolated 0.25 pc2 dense clump d. The column density map is then decomposed into column density increments. Bottom half: column density increments are converted into volume density increments by ascribing to them depths equal to the square root of their area (3 pc, 2 pc, 1 pc and 0.5 pc for the diffuse background, the envelope, the core, and the clump, respectively). The final volume density structure is obtained by summing the volume density increments, assuming that each successive increment is nested within the volume underlying the previous contour. The nested volumes are represented in the mid-plane along the line of sight only by convention.
Current usage metrics show cumulative count of Article Views (full-text article views including HTML views, PDF and ePub downloads, according to the available data) and Abstracts Views on Vision4Press platform.
Data correspond to usage on the plateform after 2015. The current usage metrics is available 48-96 hours after online publication and is updated daily on week days.
Initial download of the metrics may take a while.