Fig. B.1.
Download original image
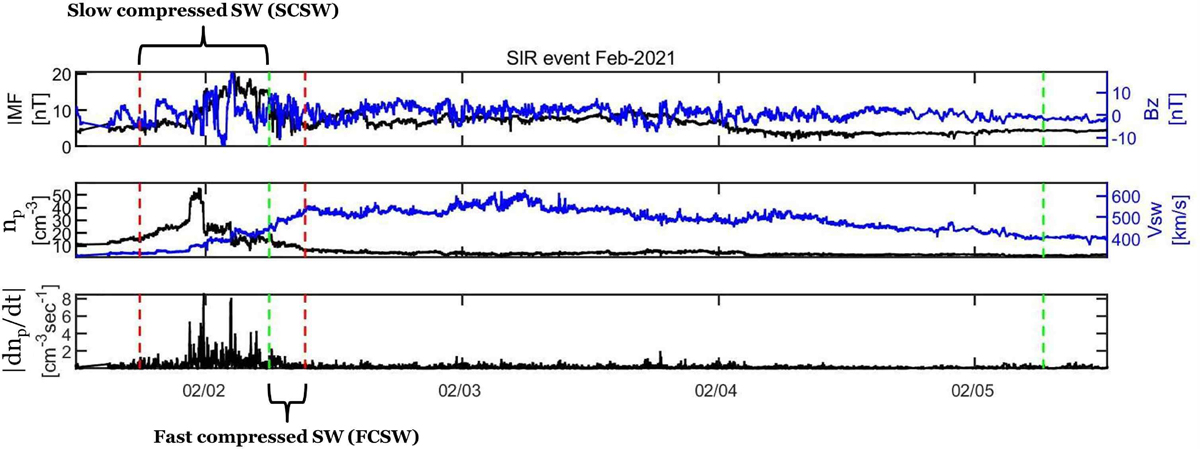
Example of an SIR event. Top panel: IMF and its z-component (black and blue solid lines, respectively). Middle panel: Proton number density and solar wind bulk speed. Bottom panel: Proton number density gradient. The red and green vertical lines delimit the SIR region and the fast solar wind stream (> 450 km/s), respectively. The brackets further indicate the SCSW (first red to first green vertical line) and FCSW (first green to second red vertical line).
Current usage metrics show cumulative count of Article Views (full-text article views including HTML views, PDF and ePub downloads, according to the available data) and Abstracts Views on Vision4Press platform.
Data correspond to usage on the plateform after 2015. The current usage metrics is available 48-96 hours after online publication and is updated daily on week days.
Initial download of the metrics may take a while.