Fig. 3.
Download original image
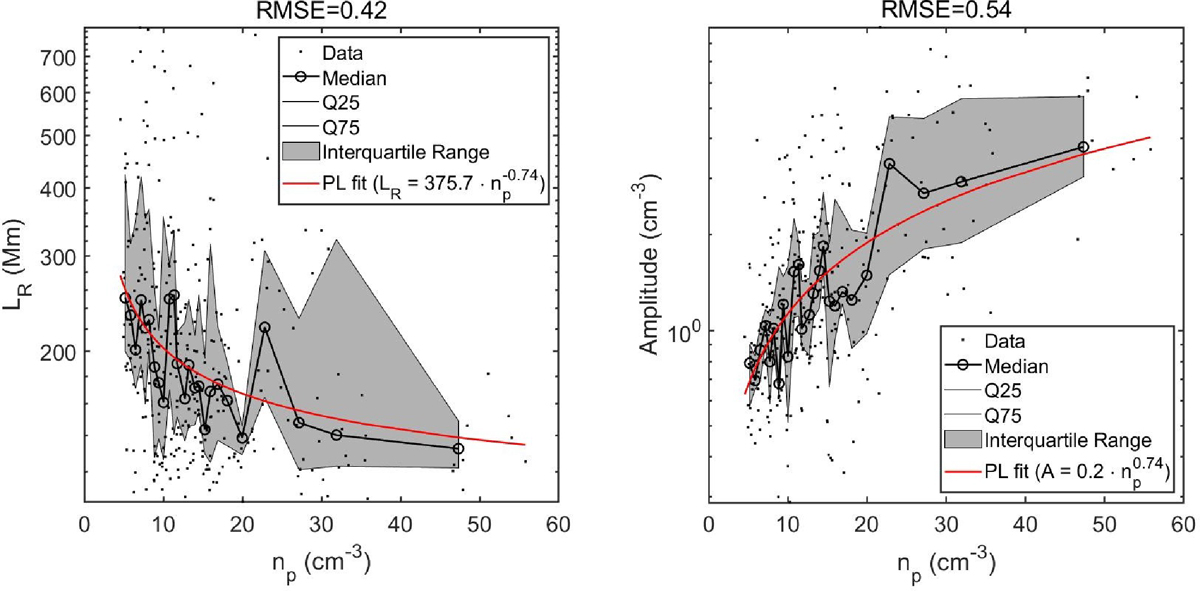
Dependence of the coherent PDS radial length scale (left panel) and power spectral density (right panel) on solar wind proton density. Grey dots correspond to the data and the solid black lines to the median of each np bin, respectively, while the shaded grey area is the inter-quartile range. The power law fit on the data is depicted with the solid red line, while the root mean square error (RMSE) is given at the top of each panel.
Current usage metrics show cumulative count of Article Views (full-text article views including HTML views, PDF and ePub downloads, according to the available data) and Abstracts Views on Vision4Press platform.
Data correspond to usage on the plateform after 2015. The current usage metrics is available 48-96 hours after online publication and is updated daily on week days.
Initial download of the metrics may take a while.