Fig. 12.
Download original image
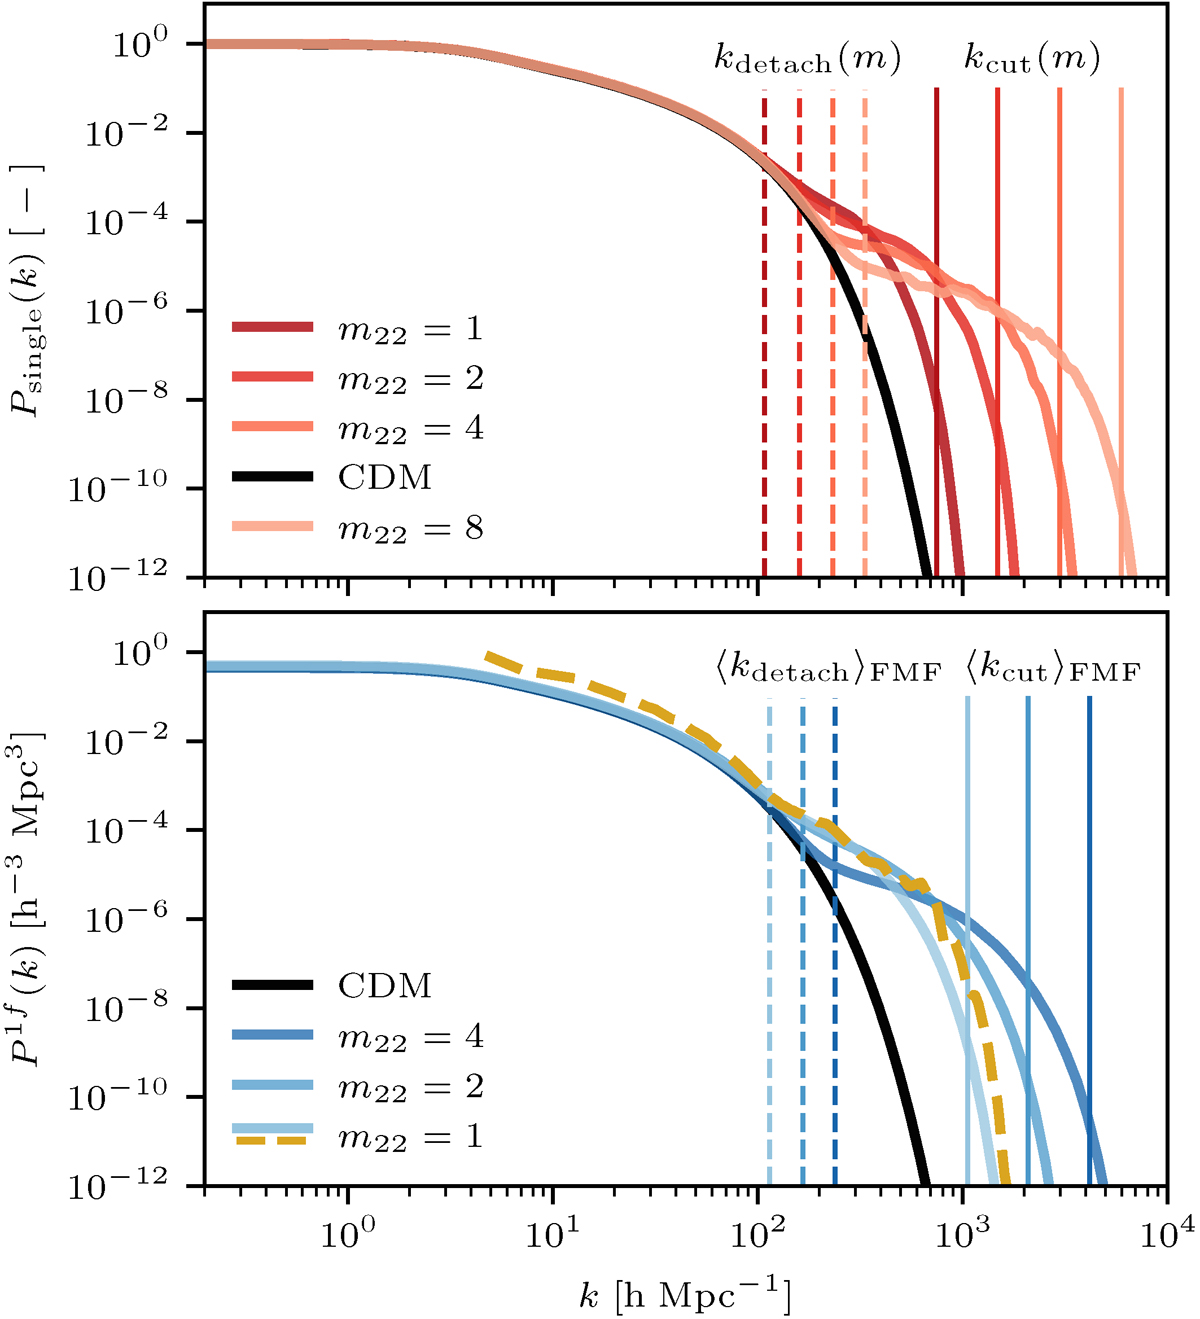
Three-dimensional filament matter power spectra of the interference-free CDM background and the reconstructed FDM density for a selection of FDM masses at z = 4. Top: Single filament spectrum, Psingle(k ∣ M), for an example filament of total mass M = 5 × 10⁹ h−1 M⊙. One finds all FDM spectra to be compatible with CDM down to the spatial extent of the ground state, Rgs ≡ ⟨ψ0|R|ψ0⟩ (vertical, dashed line) – effectively the characteristic scale of the cylinder. Once sufficiently small scales inside the filament are probed, the interference contribution to |ψ|2 enhances the two point density correlation and boosts Psingle(k ∣ M) above the CDM baseline. Note that for larger m22: (i) Psingle(k ∣ M) detaches later from the CDM baseline, (ii) the boost is shallower but (iii) extends to higher k until the suppression scale kcut ∝ m is reached (vertical, solid lines). Bottom: One-filament term P1f(k) – a stacked version of many Psingle(k ∣ M), weighted according to the FMF in Fig. 10. We limit the filament population to the mass window M ∈ [3×10⁹, 3×10¹⁰] h−1 M⊙ and compute the one filament term either directly from the semi-analytical expression of the wave function developed in Appendix D (solid, blue) or by populating a box as shown in Fig. 11 (dashed, yellow). All quantitative observations made for the single cylinder case translate to P1f(k) after a FMF-weighted average according to Eq. (45), i.e., Rgs → ⟨Rgs⟩FMF (vertical, dashed lines) and kcut → ⟨kcut⟩FMF (vertical, solid lines).
Current usage metrics show cumulative count of Article Views (full-text article views including HTML views, PDF and ePub downloads, according to the available data) and Abstracts Views on Vision4Press platform.
Data correspond to usage on the plateform after 2015. The current usage metrics is available 48-96 hours after online publication and is updated daily on week days.
Initial download of the metrics may take a while.