Open Access
Fig. A.2.
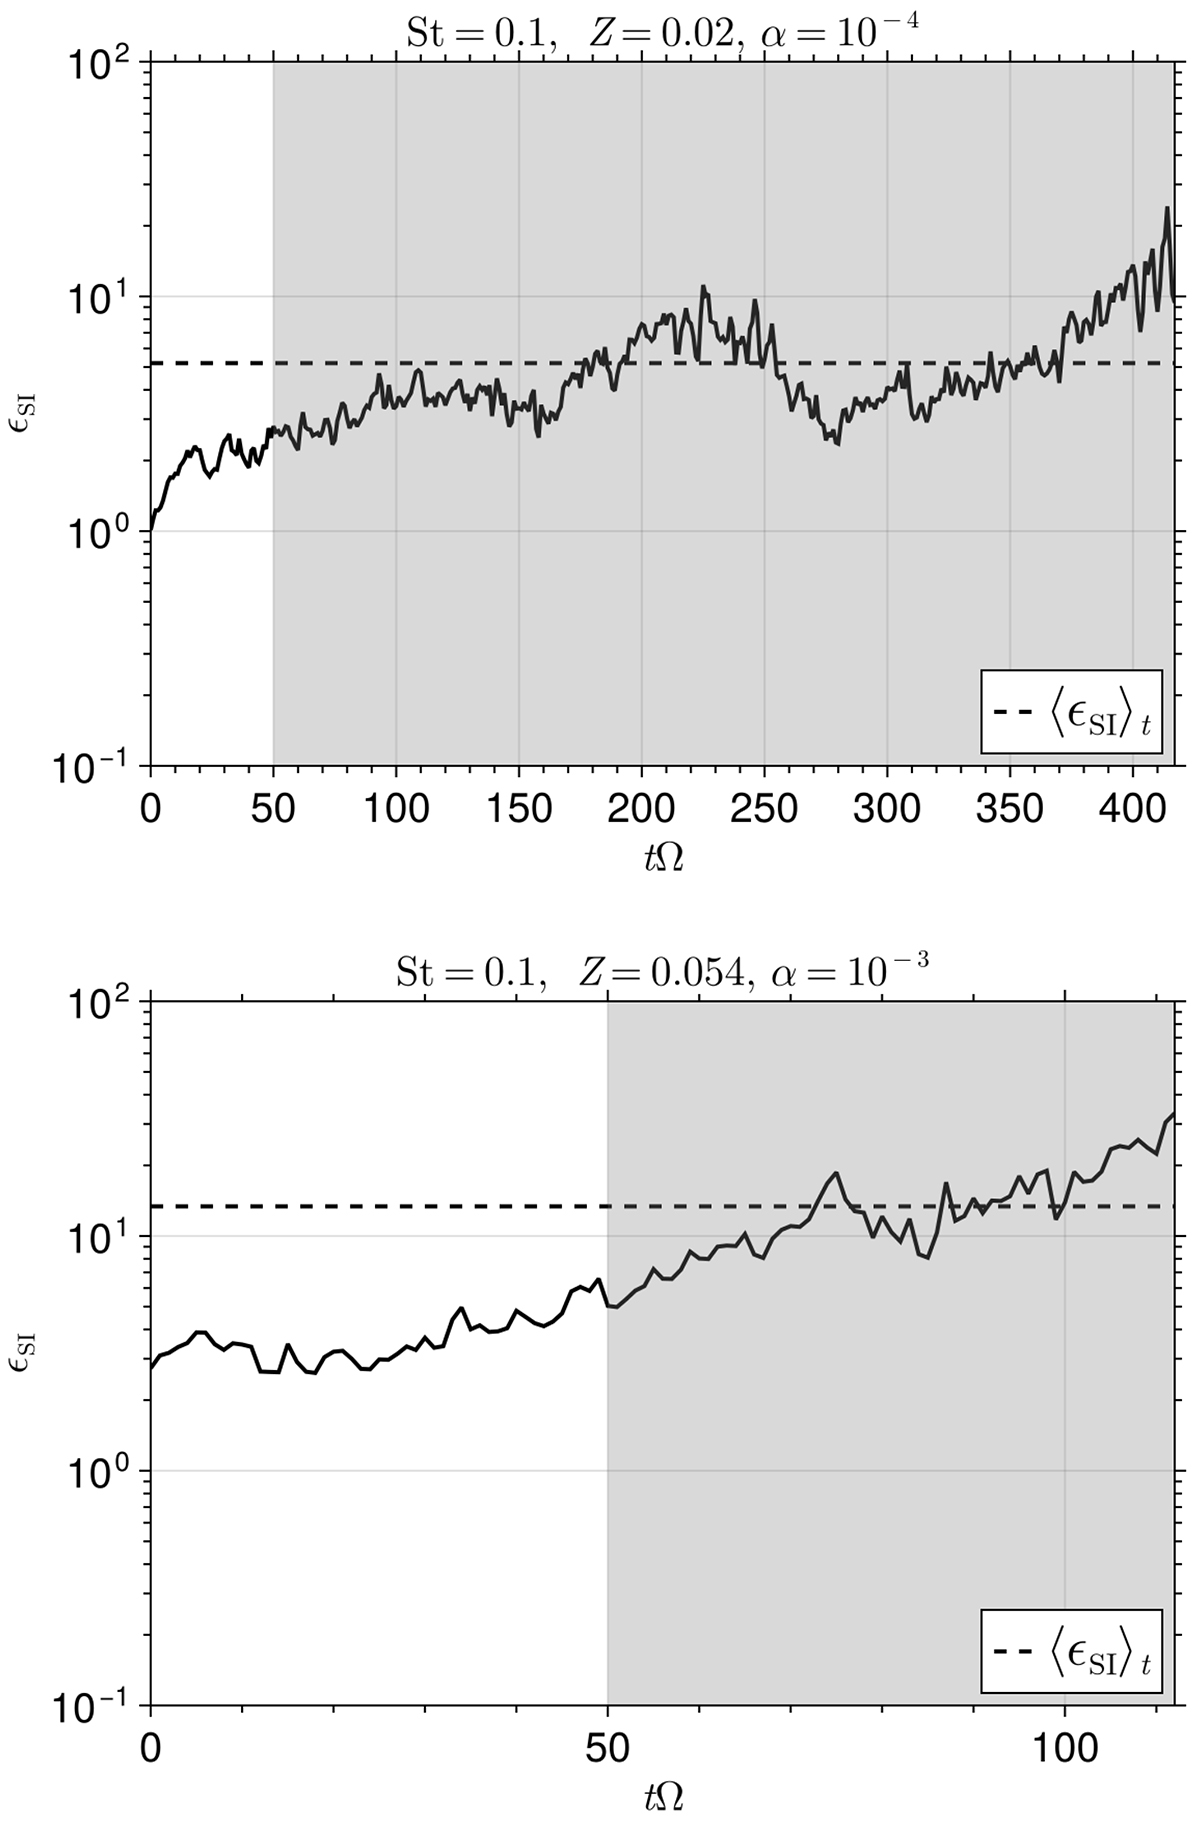
Download original image
Time series of ϵSI for two sample runs. The gray region shows the time interval between the moment that the simulation reaches a saturated state, until the moment when ρp crosses the Hill density (and self-gravity starts to dominate). For each simulation we compute the time average ⟨ϵSI⟩t over this interval.
Current usage metrics show cumulative count of Article Views (full-text article views including HTML views, PDF and ePub downloads, according to the available data) and Abstracts Views on Vision4Press platform.
Data correspond to usage on the plateform after 2015. The current usage metrics is available 48-96 hours after online publication and is updated daily on week days.
Initial download of the metrics may take a while.