Fig. 5
Download original image
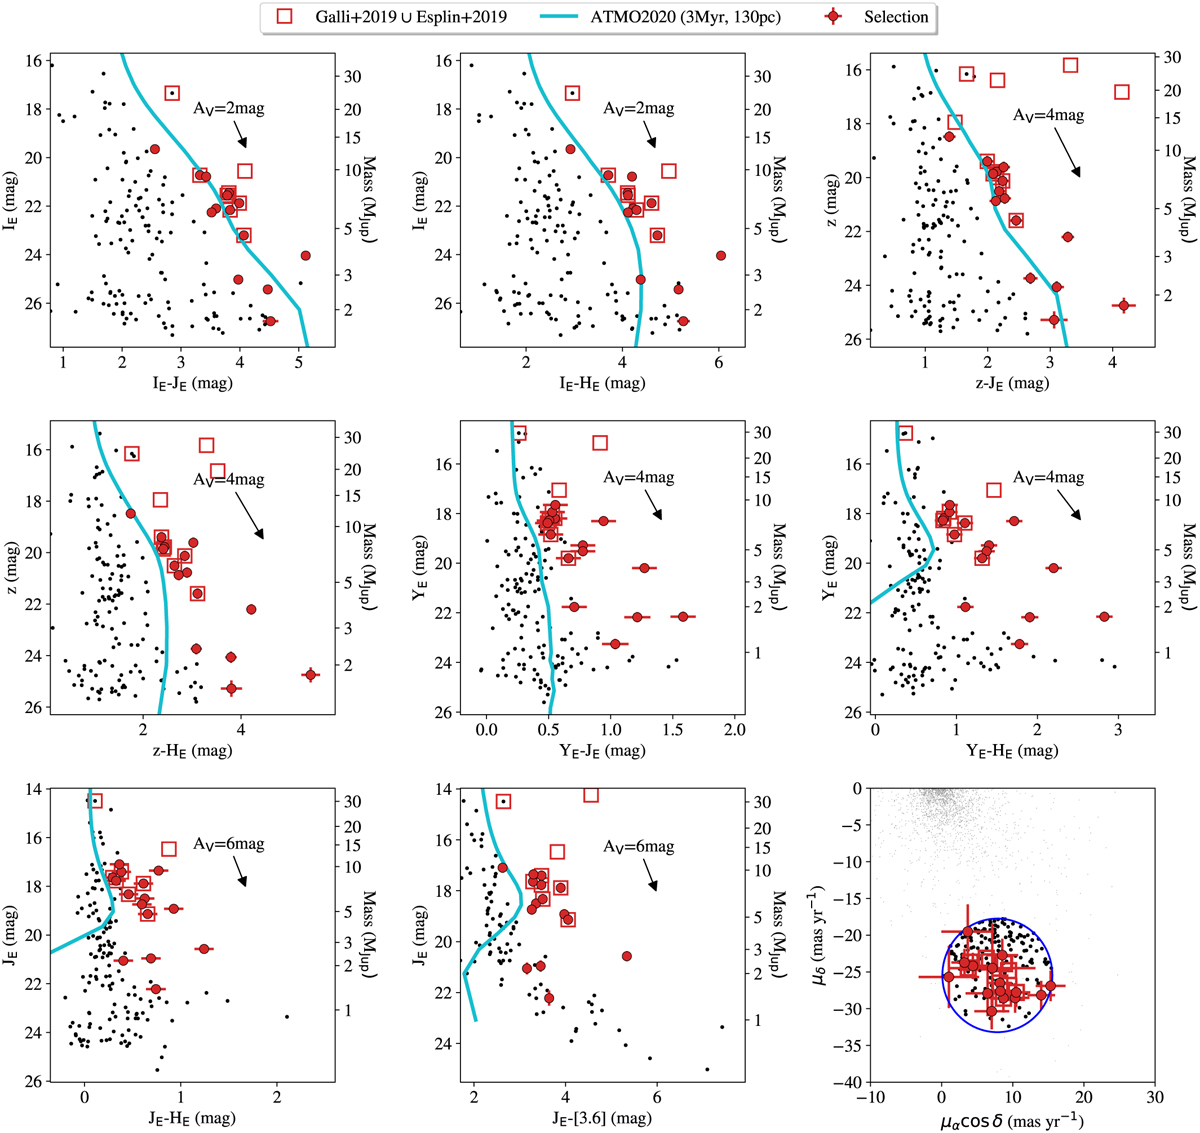
Color-magnitude and proper motion diagrams used for the candidate selection. The sources selected using the SPREAD_MODEL and proper motion criteria described in the text are represented with black dots. The 15 objects selected in this work are represented with red dots. Known Taurus members from Galli et al. (2019) and Esplin & Luhman (2019) present in the Euclid images are overplotted with red open squares. The Chabrier et al. (2023) isochrone for 3 Myr and 130 pc is represented by a light blue curve. The corresponding mass scale is indicated on the right axis. Extinction vectors are also represented.
Current usage metrics show cumulative count of Article Views (full-text article views including HTML views, PDF and ePub downloads, according to the available data) and Abstracts Views on Vision4Press platform.
Data correspond to usage on the plateform after 2015. The current usage metrics is available 48-96 hours after online publication and is updated daily on week days.
Initial download of the metrics may take a while.