Fig. 3
Download original image
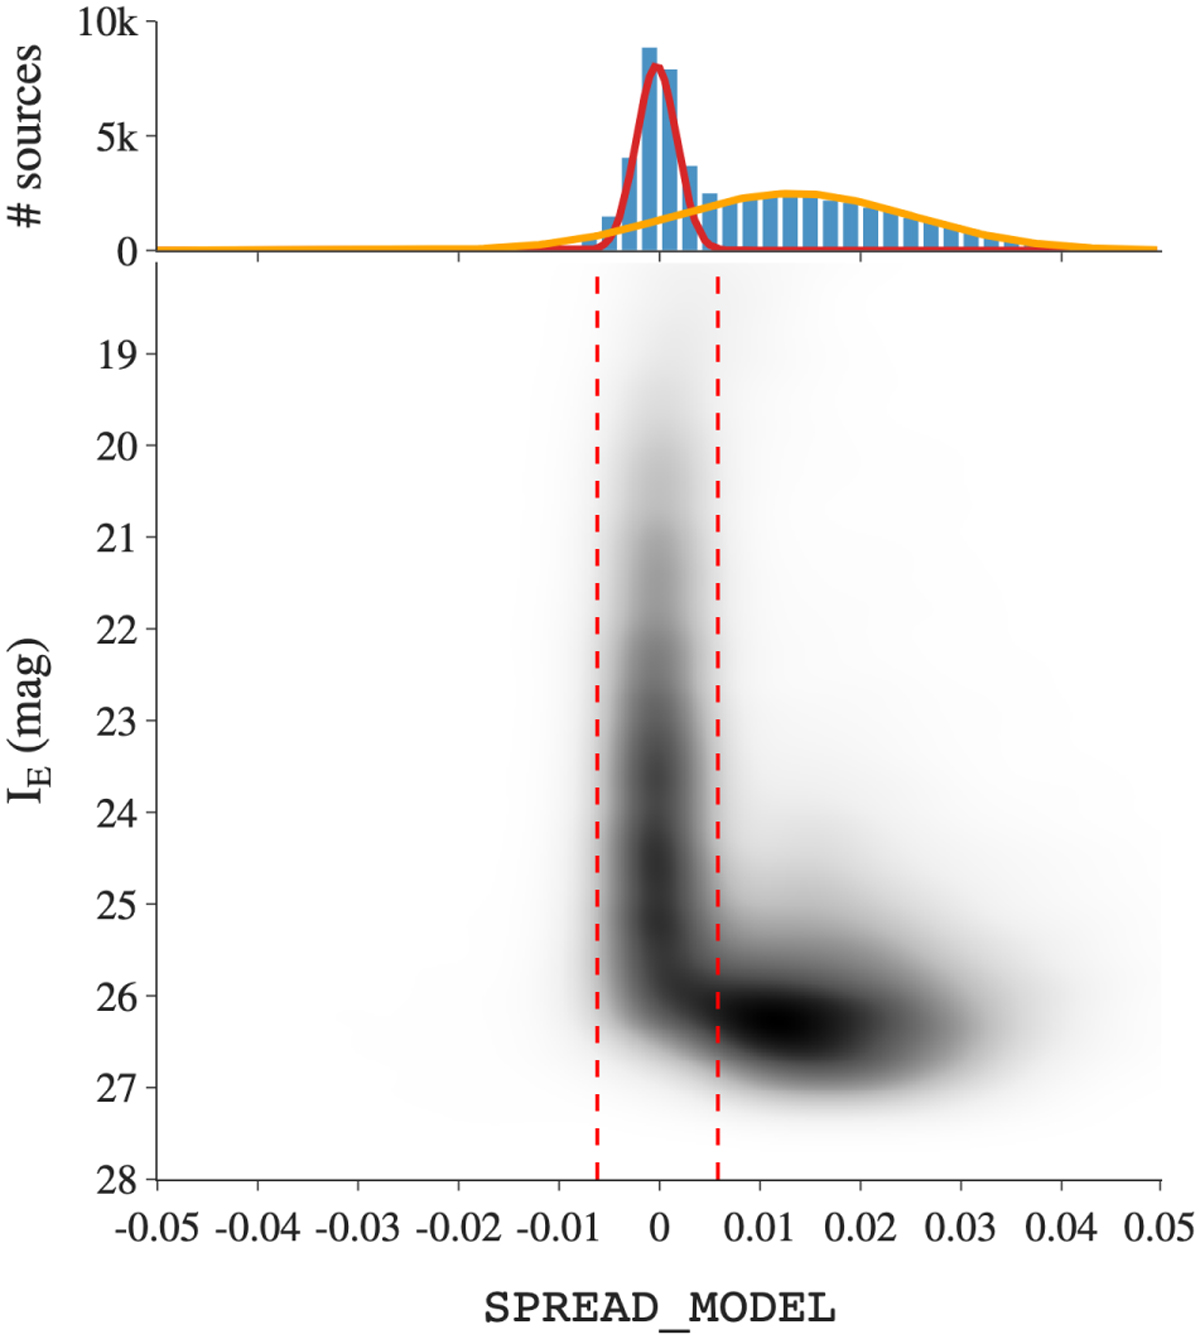
Distribution (kernel density estimate) of the SPREAD_MODEL as a function of IE magnitude. Two normal distributions were adjusted to the histogram of SPREAD_MODEL (upper panel). The Gaussian fits to the histogram of the distribution are represented in red and orange. The dashed vertical lines indicate the 3σ limits we chose to distinguish between point sources and extended sources.
Current usage metrics show cumulative count of Article Views (full-text article views including HTML views, PDF and ePub downloads, according to the available data) and Abstracts Views on Vision4Press platform.
Data correspond to usage on the plateform after 2015. The current usage metrics is available 48-96 hours after online publication and is updated daily on week days.
Initial download of the metrics may take a while.