Open Access
Fig. 2
Download original image
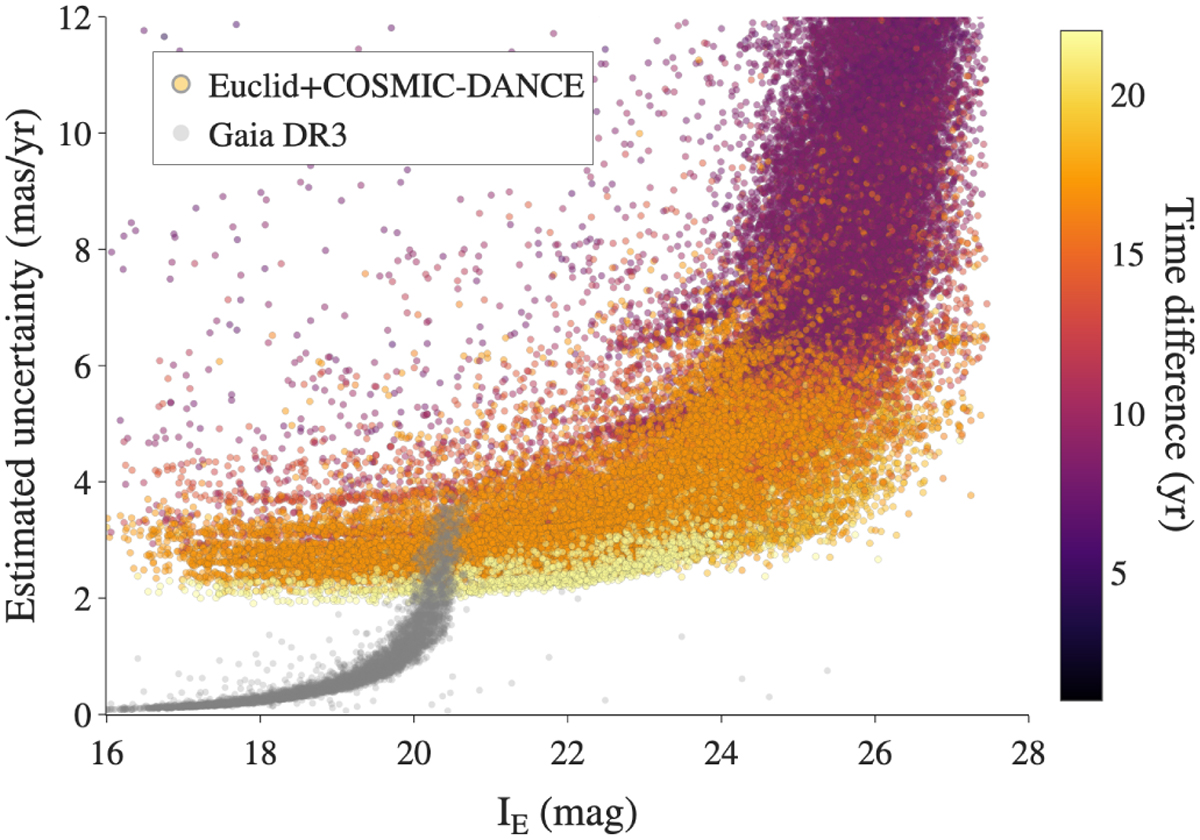
Estimated uncertainties on the proper motions vs. IE magnitude for all the sources in the Euclid field. The color scale represents the time difference between the Euclid and the earliest observations available for a source. The Gaia DR3 catalog over the same area is overplotted as gray dots.
Current usage metrics show cumulative count of Article Views (full-text article views including HTML views, PDF and ePub downloads, according to the available data) and Abstracts Views on Vision4Press platform.
Data correspond to usage on the plateform after 2015. The current usage metrics is available 48-96 hours after online publication and is updated daily on week days.
Initial download of the metrics may take a while.