Fig. B.2
Download original image
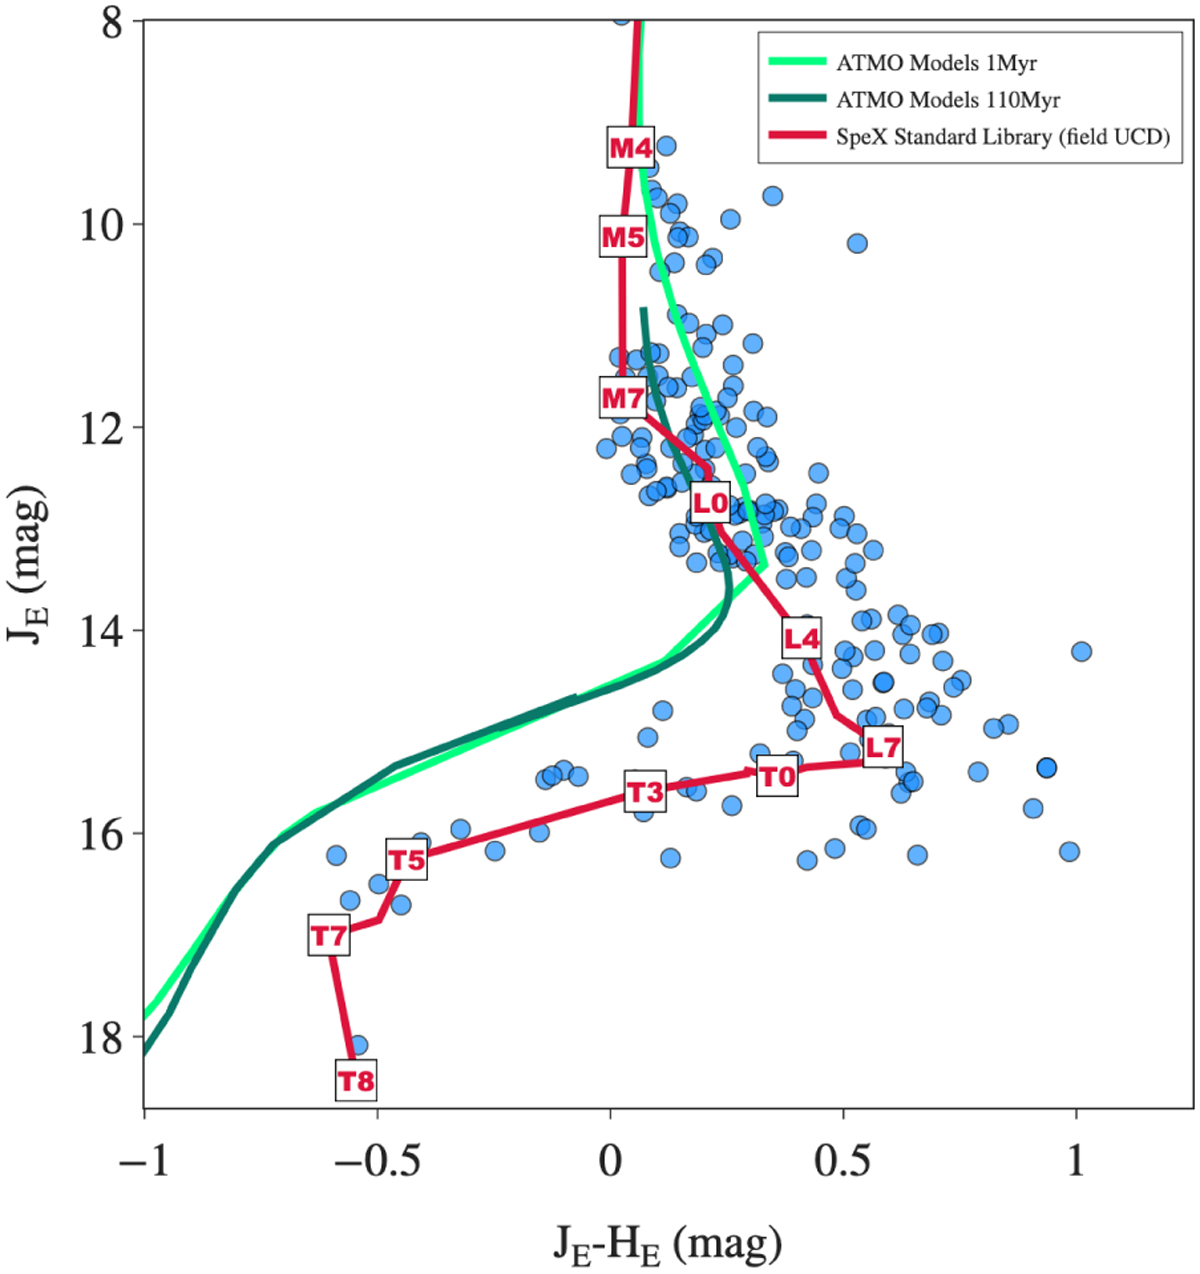
Absolute (JE, JE-HE) color-magnitude diagram for the known young or low-gravity ultracool dwarfs from Table B.1 (blue dots). The Chabrier et al. (2023) models for 1 and 110 Myr are represented as light and dark green lines, respectively. The SPLAT standard spectral sequence for older field ultracool dwarfs presented in Table B.2 is represented in red, and the corresponding spectral types are indicated.
Current usage metrics show cumulative count of Article Views (full-text article views including HTML views, PDF and ePub downloads, according to the available data) and Abstracts Views on Vision4Press platform.
Data correspond to usage on the plateform after 2015. The current usage metrics is available 48-96 hours after online publication and is updated daily on week days.
Initial download of the metrics may take a while.