| Issue |
A&A
Volume 696, April 2025
|
|
|---|---|---|
| Article Number | A199 | |
| Number of page(s) | 12 | |
| Section | The Sun and the Heliosphere | |
| DOI | https://doi.org/10.1051/0004-6361/202553806 | |
| Published online | 18 April 2025 | |
Investigation of the inverse velocity dispersion in a solar energetic particle event observed by Solar Orbiter
1
Institute of Experimental and Applied Physics, Kiel University, Leibnizstrasse 11, D-24118 Kiel, Germany
2
Johns Hopkins Applied Physics Lab, Laurel, MD 20723, USA
3
Centre for mathematical Plasma Astrophysics, KU Leuven Campus Kulak, 8500 Kortrijk, Belgium
4
National Key Laboratory of Deep Space Exploration/School of Earth and Space Sciences, University of Science and Technology of China, Hefei 230026, China
5
Institute of Physics, University of Graz, Graz, Austria
6
Universidad de Alcalá, Alcalá de Henares 28805, Spain
7
Southwest Research Institute, San Antonio, TX 78228, USA
8
California Institute of Technology, MC 290-17, Pasadena, CA 91125, USA
⋆ Corresponding author: This email address is being protected from spambots. You need JavaScript enabled to view it.
Received:
18
January
2025
Accepted:
15
March
2025
Abstract
Context. Solar energetic particle (SEP) events provide crucial insights into particle acceleration and transport mechanisms in the heliosphere. Inverse velocity dispersion (IVD) events, characterized by higher-energy particles that arrive later than lower-energy particles, challenge the classical understanding of SEP events and are increasingly observed by spacecraft, such as Parker Solar Probe and Solar Orbiter. However, the mechanisms underlying IVD events remain poorly understood.
Aims. We investigate the physical processes that cause long-duration IVD events by analyzing the SEP event observed by Solar Orbiter on 2022 June 7. We explore the role of evolving shock connectivity, particle acceleration at interplanetary (IP) shocks, and cross-field transport in shaping the observed particle profiles.
Methods. We used data from the Energetic Particle Detector (EPD) suite on board Solar Orbiter to analyze the characteristics of the IVD, and we modeled the event using the heliospheric energetic particle acceleration and transport (HEPAT) model. The simulations tracked evolutions of shock properties, particle acceleration and transport to assess the influence of shock expansion, shock connectivity, and transport processes on the formation of IVD events.
Results. The IVD event exhibited a distinct and long-duration IVD signature across proton energies from 1 to 20 MeV, and it lasted for approximately 10 hours. Heavy ions exhibited varying nose energies, defined as the energy corresponding to the first-arriving particles. Simulations suggest that evolving shock connectivity and the evolution of the shock play a primary role in the IVD signature. The magnetic connection shifts from the shock flank to the nose over time, which results in a gradual increase in the maximum particle energy along the field line. Furthermore, the model results show that limited cross-field diffusion can influence both the nose energy and the duration of the IVD event.
Conclusions. This study demonstrates that long-duration IVD events are primarily driven by evolving magnetic connectivity along a nonuniform shock that evolves over time, where the connection moves to more efficient acceleration sites as the shock propagates farther from the Sun. Other mechanisms, such as the acceleration time at the shock, may also contribute to the observed IVD features. The interplay of these factors remains an open question that warrants further investigation in other events.
Key words: Sun: coronal mass ejections (CMEs) / Sun: particle emission
© The Authors 2025
 Open Access article, published by EDP Sciences, under the terms of the Creative Commons Attribution License (https://creativecommons.org/licenses/by/4.0), which permits unrestricted use, distribution, and reproduction in any medium, provided the original work is properly cited.
This article is published in open access under the Subscribe to Open model. This email address is being protected from spambots. You need JavaScript enabled to view it. to support open access publication.
1. Introduction
Solar energetic particle (SEP) events are associated with solar eruptions such as flares and coronal mass ejections (CMEs). They provide critical insights into particle acceleration and transport mechanisms. Large SEP events are typically associated with shock waves driven by CMEs that can accelerate particles to relativistic energies (see the reviews by Desai & Giacalone 2016; Reames 1999). These shocks are efficient sites for particle acceleration, which is primarily considered to occur through the mechanism of diffusive shock acceleration (DSA; Axford et al. 1977; Drury 1983). In the DSA mechanism, the particle transport around the shock is governed by diffusion, with particles freely traversing the shock front. This diffusion arises from the scattering of particles by magnetic field irregularities that are convected by the ambient plasma flow. Every time the particles cross the shock, they receive a net energy gain. This iterative process accelerates particles to higher energies, and thus, the maximum particle energy is controlled by the scattering efficiency and the finite acceleration time. After accelerated particles escape from the traveling shock front, they propagate along the interplanetary magnetic field (IMF). During their propagation, particles undergo a series of transport processes, including magnetic focusing and mirroring, pitch-angle scattering, and adiabatic momentum changes, which shape their spatio-temporal and energy distributions (Li et al. 2003; Wijsen et al. 2019; Hu et al. 2018). In addition to field-aligned propagation, particles may diffuse perpendicular to the magnetic field, which enables cross-field transport and allows the particles to spread widely in longitude and latitude (e.g., Dwyer et al. 1997; Strauss et al. 2017; Wang et al. 2012). This cross-field transport is essential for explaining the widespread SEP events, especially at locations that are magnetically disconnected from the initial shock region (e.g., Li et al. 2021; Ding et al. 2022b). Ultimately, the combination of particle acceleration at the traveling shock and particle propagation along and across the field lines governs the distribution of SEP intensity throughout the heliosphere, and it influences the time-intensity profiles recorded by spacecraft atdifferent vantage points.
When particles are released from the shock simultaneously, high-energy particles arrive at the observer earlier than lower-energy particles. This behavior, known as velocity dispersion (VD), is often observed in the initial phase of SEP events (see e.g., McCracken & Rao 1970; Reames et al. 1997; Kollhoff et al. 2021; Wimmer-Schweingruber et al. 2023). Velocity dispersion analysis (VDA) assumes the scatter-free propagation of particles along magnetic field lines, which means that their energy-dependent arrival times can be used for estimating the particle release time and the path length (Tylka et al. 2003; Laitinen et al. 2015). Recently, a rare event characterized by a prominent inverse velocity dispersion (IVD) was observed by Parker Solar Probe (PSP; Fox et al. 2016) at a solar distance of 15 solar radii (Cohen et al. 2024), where higher-energy particles arrived later than lower-energy particles. In the dynamic spectrum, this event exhibits a well-defined nose structure, and the nose energy for protons is about 1 MeV. The nose energy corresponds to the energy channel of the first-arriving particles. In this event, the duration of the IVD is approximately half an hour as measured from the onset time of the nose energy to the onset of the highest-energy particles. Cohen et al. (2024) suggested that this phenomenon might well be explained by the DSA process. It requires time for particles to be accelerated to high energies. Therefore, when an observer is sufficiently close to a shock undergoing particle acceleration, lower-energy particles that have undergone a shorter acceleration process are likely to reach the observer first, followed by higher-energy particles. Additionally, Kouloumvakos et al. (2025) suggested that the observed IVD might be attributed to a relatively slow, ongoing particle acceleration process that occurs at the flank of the expanding shock wave that is intercepted by PSP. This slow acceleration process is due to the initial magnetic connection of PSP to a weak region of the shock that gradually strengthens as the shock expands. It is reasonable that the continuous particle acceleration and the initial expansion of the shock collectively contribute to the observed IVD. Because PSP is located so close to the Sun, the short duration of the IVD minimizes the influence of magnetic connectivity variations and particle transport effects. This creates a unique observational perspective in which PSP can effectively probe time-dependent particle acceleration and the evolving shock strength at a nearly fixed location along the shock front. These observations provide critical insights into the early-stage shock dynamics and the microphysics of SEP acceleration near the Sun.
By extending the scenario suggested above, we note that particle acceleration at shocks is a dynamic process resulting from the time-dependent interplay of multiple factors. As shown by Zank et al. (2000), the acceleration timescale at a shock depends not only on the varying shock strength, but also on the concurrent weakening of the magnetic field with heliocentric distance (R), which typically decreases as R−2 in the young solar wind. This establishes a direct competition: The rate at which the shock strength evolves must be balanced against the decay of the magnetic field for a determination of the efficiency of particle acceleration. Furthermore, the shock geometry and the associated intensity of upstream waves further complicate the determination of the acceleration time. A key factor for particle acceleration at quasi-parallel shocks is the excitation of the upstream scattering wave by the energetic particles that escape upstream from the shock. For quasi-perpendicular shocks, wave excitation is quenched, and particle scattering must therefore rely on the ambient solar wind turbulence that is convected into the shock. As suggested by Zank et al. (2006), the inclusion of wave excitation at quasi-parallel shocks can reduce their timescale even further, resulting in faster acceleration, although quasi-perpendicular shocks yield significantly shorter acceleration timescales than quasi-parallel shocks. In addition, the injection energy plays an important role in shock acceleration: Quasi-perpendicular shocks require a higher injection energy than quasi-parallel shocks (Zank et al. 2006; Li et al. 2012; Ding et al. 2023). These physical processes have been widely examined using the particle acceleration and transport in the heliosphere (PATH) model (Zank et al. 2000; Li et al. 2003, 2005; Rice et al. 2003) and two-dimensional (2D) improved PATH model (Hu et al. 2017), providing comprehensive insights into the particle acceleration and transport in gradual SEP events.
Interestingly, IVD events are not exclusively observed by PSP close to the Sun. As the solar activity increases with the rise toward the solar maximum of cycle 25, Solar Orbiter (Müller et al. 2020) has detected more than ten so-called IVD events at varying radial distances over the past few years (see Li et al. (2025) for details). These events exhibit distinct nose energies that range from a few MeV to dozens of MeV, and they display varying IVD durations. In comparison to the PSP event on 2022 September 5, where the IVD only lasted approximately half an hour, some Solar Orbiter events have an IVD duration longer than 10 hours. This extended duration provides important insights that might challenge interpretations that IVD is solely a result of the acceleration time at the shock front. In situ observations of SEP events inherently reflect the interplay between particle acceleration and transport processes. As the shock propagates outward, the magnetic connectivity between the observer and the shock naturally evolves, suggesting that long-duration IVD events may not be explained by acceleration processes alone. In these cases, shock connectivity, the evolution of the shock itself, and transport effects, such as cross-field diffusion, cannot simply be disregarded.
The long-duration IVD events observed by Solar Orbiter highlight the need for a more detailed study to fully understand the origins and variations in IVD events. We focus on analyzing a well-defined IVD event observed by Solar Orbiter on 2022 June 7 that exhibited a distinct nose structure and a long IVD duration. It provides an ideal example to investigate the underlying mechanisms that generate IVD signatures. A more comprehensive list of IVD events can be found in Li et al. (2025). Section 2 provides an overview of the measurements we used and the modeling framework employed to simulate this event. Section 3 presents the analysis of the observational data and model results and offers qualitative insights into the formation of IVD events. The main conclusions are summarized in Sect. 4.
2. Data and methods
We used data collected by the instruments on board Solar Orbiter. Specifically, SEP measurements were obtained using the Energetic Particle Detector suite (EPD; Rodríguez-Pacheco et al. 2020; Wimmer-Schweingruber et al. 2021), which includes the Supra-Thermal Electron and Proton sensor (STEP), the Electron Proton Telescope (EPT), the High Energy Telescope (HET), and the Suprathermal Ion Spectrograph (SIS). These instruments provide data for electron energies ranging from a few keV to tens of MeV, and for ions, the energies range from a few keV nucleon−1 to over 100 MeV nucleon−1. EPD provides coverage in four viewing directions through EPT and HET, in one direction through STEP, and in two directions through SIS. A detailed description of the EPD instrument, including the energy ranges for each sensor, particle species, and fields of view, is available in Rodríguez-Pacheco et al. (2020). The averaged particle intensity from different telescopes was used for a comparison with the omnidirectional intensity in the model. It is important to note that STEP and EPT do not explicitly distinguish between various ion species. The measured fluxes are typically interpreted as being dominated by protons, which are the most abundant ion species in large SEP events. Magnetic field data were obtained through measurements from the Solar Orbiter Magnetometer (MAG; Horbury et al. 2020), and the plasma data were collected using the Proton-Alpha Sensor in Solar Wind Analyzer (SWA-PAS; Owen et al. 2020).
To simulate the observed IVD features, we employed the three-dimensional (3D) SEP model called heliospheric energetic particle acceleration and transport (HEPAT; Ding 2024). The HEPAT model was developed based on the one-dimensional (1D) PATH model (Zank et al. 2000; Li et al. 2003, 2005) and 2D iPATH model (Hu et al. 2017), which are physics-based models for simulating particle acceleration and transport in gradual SEP events. The PATH and iPATH models were proven to be successful in modeling some large SEP events and explaining the longitudinal dependence of the SEP intensity (e.g., Verkhoglyadova et al. 2009, 2010; Hu et al. 2018; Ding et al. 2020; Li et al. 2021; Ding et al. 2022b,a). The HEPAT model consists of three main modules that we describe next. (1) The MHD module is coupled with the European heliospheric forecasting information asset (EUHFORIA; Pomoell & Poedts 2018), which is a comprehensive data-driven coronal and heliospheric model specifically designed for space weather forecasting. This module simulates data-driven solar wind and CME eruptions. (2) The acceleration module uses shock information derived from EUHFORIA. This module calculates the time-dependent shock acceleration based on the DSA mechanism. It accounts for particle injection, self-generated wave intensity near the shock, maximum particle energy, and particle diffusion and escape from the shock. (3) The transport module solves the 3D focused transport equation (Skilling 1971) using the backward stochastic differential equation method to obtain time-intensity profiles at virtual observers.
The general simulation flow proceeds as follows. In the MHD module, CME eruptions are simulated using the Cone model (Odstrcil et al. 2004), which treats the CME as a hydrodynamic plasma cloud with enhanced density and speed. This is inserted into the background solar wind with a constant speed and angular width. Following the method described in Ding et al. (2022b), we then identified the shock positions from the EUHFORIA simulation and derived the key shock parameters, including the shock speed, the shock compression ratio, and the shock obliquity. These parameters are essential inputs for capturing the dynamic evolution of the shock acceleration. In the acceleration module, the steady-state DSA solution was then calculated based on the inputs of the shock parameters. The accelerated particles, which convect with the shock and diffuse downstream of the shock, were tracked. The instantaneous escaped particle distribution functions at the shock front were recorded as the source for the particle transport. Finally, the time-intensity profiles at a desired observer were obtained from the transport module for a comparison with measurements.
A detailed description of the HEPAT model was provided by Ding (2024). We briefly discuss the critical parameters relevant to this work. Solving the continuous time-dependent shock acceleration is computationally demanding. Therefore, shock parameters derived from EUHFORIA with a time step of one hour were passed to the acceleration module to compute the steady-state DSA solution along the shock surface. One key parameter in understanding IVD events is the maximum particle energy of the particle acceleration at the shock. In the steady-state solution of the DSA mechanism, we assumed that the shock parameters do not vary significantly over the shock dynamic timescale (Zank et al. 2000), defined as  , where R is the radial distance of the shock from the Sun. The maximum particle momentum, pmax, is therefore determined by balancing the acceleration time (Drury 1983) with tdyn,
 (1)
(1)
where pinj is the injection momentum, s is the shock compression ratio, κup is the particle diffusion coefficient upstream of the shock, and Uup is the upstream flow speed in the shock frame. The acceleration time downstream of the shock is neglected under the assumption that the downstream diffusion coefficient is significantly smaller than upstream values (Axford 1981). With these assumptions, the instantaneous pmax can be regarded as an approximation to the time-dependent DSA solution.
We followed the approach in the PATH/iPATH models to obtain κup, given by κup = κ∥cos2θBN + κ⊥sin2θBN, where θBN is the shock obliquity angle, and κ∥ and κ⊥ represent the parallel and perpendicular diffusion coefficients, respectively (e.g., Zank et al. 2000; Rice et al. 2003; Li et al. 2005, 2012; Hu et al. 2017). To determine κ∥ upstream of the shock, it is necessary to evaluate the wave intensity. For a CME-driven shock, Alfvén waves driven by protons stream from the shock front that serves as the primary source of upstream turbulence that confines particles near the shock. The concept of scattering particles by Alfvén waves near a shock was initially proposed by Bell (1978) and further developed into a coupled wave-particle quasi-linear model by Lee (1983). We employed a steady-state solution of the wave intensity in front of the shock as described by Gordon et al. (1999). This approach enabled us to derive the wave action and the energetic particle spectrum in a time-dependent manner. The amplified waves are proportional to the flux of streaming accelerated protons, which itself is related to the injection speed Vinj. For particles to participate in the DSA process, their speeds must exceed an injection threshold so that they can scatter diffusively across the shock, which refers to the injection speed. A key challenge in DSA is determining how particles are injected from the thermal or superthermal plasma at the shock. A classic approach, introduced by Giacalone & Jokipii (1999) and Zank et al. (2006), ensures small particle anisotropy when applying the Parker transport equation. In this method, the injection speed is determined by constraining the total anisotropy ξ to be lower than one. However, this approach requires knowledge of the diffusion coefficients, while the injection speed itself is needed to compute the amplified wave intensity at the shock front. This creates a dependence issue. To circumvent this, Li et al. (2012) proposed an analytical expression for the injection speed based on the shock geometry and compression ratio, which we adopted. We then obtained κ⊥ from κ∥ using the analytical result derived from the extended nonlinear guiding center (NLGC) theory (Shalchi et al. 2010), which builds upon the original NLGC theory (Matthaeus et al. 2003). Detailed calculations of the injection speed, diffusion coefficients, and the corresponding particle distribution function followed the method outlined in Hu et al. (2017).
Upstream of the shock, the particle intensity falls off exponentially with a momentum-dependent diffusion length scale, λdiff, determined by the upstream diffusion coefficient (Drury 1983). Beyond a certain distance ahead of the shock, particles are assumed to escape and propagate along the interplanetary magnetic field. The escape length scale, λesc, is typically taken to be 2 − 4 times larger than λdiff, which itself depends on the turbulence strength (Zank et al. 2000; Rice et al. 2003; Li et al. 2005). This momentum-dependent escape length naturally leads to different escape processes, effectively trapping low-energy particles close to the shock because their diffusion length scale is short (Zank et al. 2006; Ding et al. 2024). However, trapping high-energy particles is more challenging because the corresponding wave intensity decays rapidly as the shock propagates outward. Although the momentum-dependent escape process affects the spectrum of escaped particles, it does not alter the IVD feature, which requires the delayed release of high-energy particles.
When particles escape from the shock, they propagate in the solar wind. The transport of escaping particles is described by the 3D focused transport equation. In the quasi-linear theory (QLT; Jokipii 1966), the pitch-angle diffusion coefficient Dμμ is given by
 (2)
(2)
where μ is the pitch-angle cosine, B is the magnetic field strength, v is the particle velocity, gslab is the turbulence power spectrum in the solar wind,  is the proton gyrofrequency, and the resonant wave number is k∥ = Ω(v|μ|)−1. gslab we used here is given by Shalchi (2009),
 (3)
(3)
where lslab = lc, slab/(2πC(ν)) is the slab bend-over scale, where the correlation length lc, slab = 1 × 10⁹ m.  is the strength of the slab magnetic field, and the inertial range spectral index is s = 2ν = 5/3. The normalization factor C(ν) equals
 (4)
(4)
where Γ(x) is the gamma function. The parallel diffusion coefficient κ∥ is commonly expressed as
 (5)
(5)
The perpendicular diffusion coefficient κ⊥ is then derived from κ∥ using the NLGC theory (Matthaeus et al. 2003; Shalchi et al. 2010),
![Mathematical equation: $$ \begin{aligned} \kappa _{\perp } = \left[ \frac{\sqrt{3}}{3} va^{2}\pi C(\nu ) \frac{\delta B^{2}_{2D}}{B^2_{0}} l_{2D}\right]^{2/3}\kappa _{\parallel }^{1/3}, \end{aligned} $$](/articles/aa/full_html/2025/04/aa53806-25/aa53806-25-eq9.gif) (6)
(6)
where the square of the turbulence magnetic field follows a radial dependence of δB2 ∼ rγ with γ = −3.5. The 2D bend-over scale is typically assumed to be l2D = 0.1lslab. We assumed the ambient turbulence level δB2/B2 to be 0.1 at 1 AU with an 80 : 20 ratio of the 2D to slab component energies. This gives a reference value of κ⊥/κ∥ = 0.0017 for 1 MeV proton at 1 au. We note that the discussion regarding the influence of perpendicular diffusion in IVD events pertains solely to the transport process and not to the shock acceleration. The role of perpendicular diffusion at CME-driven shocks was extensively discussed in Zank et al. (2006).
3. Results
3.1. Solar Orbiter observations
Figure 1 presents the 10-minute-averaged proton dynamic spectra and time-intensity profiles observed by Solar Orbiter for the 2022 June 7 event. As noted in Sect. 2, the STEP and EPT instruments do not distinguish between ion species, and the measured flux is predominantly composed of protons. Therefore, we refer to Fig. 1 as proton dynamic spectra to differentiate them from the heavy-ion measurements provided by SIS (see Fig. 2). The upper panel combines measurements from STEP with the averaged intensity obtained from the four telescopes in EPT and HET. The color-coded bins on the grid represent I ⋅ E2, where I is the particle intensity, and E is the mean energy of the corresponding channels. This representation flattens the energy spectrum, which facilitates visually identifying the velocity dispersion and inverse velocity dispersion in the SEP event. The upper panel clearly reveals the velocity dispersion in the energy channels below ∼1 MeV and the inverse velocity dispersion from approximately 1 MeV to 20 MeV. The duration of the IVD spans roughly 10 hours, from 11:00 to 22:00 UT. The transition energy from VD to IVD, referred to as the nose energy in this study, corresponds to the earliest onset time among the energy channels and is estimated to be around 1.1 MeV. The nose energy can be regarded as the maximum particle energy at the acceleration site when the observer initially establishes magnetic connectivity to that site. To determine the particle release time using the VDA method, we employed the Poisson-CUSUM method (Lucas 1985; Xu et al. 2020) to determine the onset time. We focused on energy channels between 0.1 MeV and 1 MeV. The fitting results yield a release time of 2022 June 7 at 06:29 UT ± 23 minutes and a path length of 1.56 ± 0.06 au, is consistent with significant scattering in the interplanetary medium. This release time is approximately three hours later than the CME eruption time of 2022 June 7 at 03:36 UT, as determined from the first appearance time in the LASCO/C2 field of view1. The late release time indicates that Solar Orbiter was not magnetically connected to the shock at the beginning of the CME eruption. Thus, Solar Orbiter may have started the connection to the shock flank later when the CME reached a certain height in the corona (Rouillard et al. 2011, 2012).
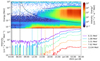 |
Fig. 1. Proton dynamic spectrum (upper panel) and time-intensity profiles (lower panel) for the 2022 June 7 event observed by STEP, EPT, and HET on board Solar Orbiter. The curved dashed line in the upper panel represents the onset times fit. The colored vertical lines in the lower panel indicate the onset times for each energy channel. The vertical solid line marks the CME eruption time, and the vertical dashed black line denotes the release time derived from VDA. |
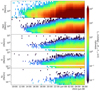 |
Fig. 2. Ion dynamic spectra for the 2022 June 7 events observed by Solar Orbiter/SIS. From top to bottom, the panels show measurements of protons, helium-4, carbon, oxygen, and iron ions. |
The bottom panel shows the time-intensity profiles of five energy channels along with their corresponding onset times. All energy channels exhibit a gradual intensity increase that reaches a plateau around 2022 June 7 at 22:00 UT. This behavior is characteristic of a typical eastern SEP event as seen from Solar Orbiter, where the magnetic footpoint of Solar Orbiter is located westward of the flare site (Cane et al. 1988; Reames 2013). The earliest onset time is approximately 2022 June 7 at 11:10 UT for the 1.08 MeV channel, and the onset times gradually increase for higher energies. This demonstrates a clear inverse velocity dispersion. In summary, this event features a long-duration IVD with a nose energy of about 1 MeV. Notably, this may be the clearest long-duration IVD event recorded by Solar Orbiter before September 2024, without perturbations of pre-events. Thus, we used this clear example to explore the possible reasons for the occurrence of IVD.
Figure 2 presents 10-minute-averaged ion dynamic spectra for the 2022 June 7 event observed by Solar Orbiter/SIS for protons, helium-4, carbon, oxygen, and iron ions. First, all species exhibit a clear IVD with a long-duration of approximately 10 hours. Second, the nose energy of these species depends on the charge-to-mass (Q/M) ratio, with the nose energy decreasing as the Q/M ratio decreases, as evident from visual inspection. We note that the ion energy mentioned below is given per nucleon. Typically, the break energy in integrated ion spectra is used to deduce Q/M-dependence (Desai et al. 2016). However, these spectra represent a combination of continuous particle injections and are naturally dominated by the later phases of the SEP event, which tend to overshadow the properties of the early-stage shock. In contrast, the nose energy provides a probe of the initial properties of the shock. We note that the acceleration of heavy ions at the shock may be different from the proton acceleration. As suggested by Li et al. (2005) and Verkhoglyadova et al. (2015), the self-generated waves at quasi-parallel and oblique shock are mainly excited by streaming protons, while heavy ions do not significantly contribute to the excitation of fluctuations because of the relatively small number density. The maximum energy was also computed based on a resonance condition, but only up to the minimum wave number excited by the energetic streaming protons. For ions at a highly perpendicular shock, the maximum energy is independent of the resonance condition and mainly depends on the shock parameters and the upstream turbulence levels. This implies a (Q/M)2 dependence of the maximum particle energy of heavy ions at quasi-parallel shocks and a (Q/M)1/2 or (Q/M)4/3 dependence at highly perpendicular shocks (Zank et al. 2006). If the nose energy represents the maximum particle energy accelerated at the shock shortly after the eruption, the Q/M dependence of the nose energy may reflect the influence of the shock geometry on the particle acceleration (Li et al. 2009). However, this dependence can be further complicated by diffusive transport effects, which can lead to the earlier arrival of ions with lower Q/M ratios (Mason et al. 2012). Determining the precise nose energy of heavy ions in this event is challenging because the statistics for heavier ions are low (e.g., Fe). We did not explore this relation, but focused on investigating the possible reason for the formation of IVD.
3.2. Model results
Figure 3a shows snapshots of the radial speed of the solar wind between 0.1 au to 2 au from EUHFORIA simulations for this event, presented in the Heliocentric Earth Equatorial (HEEQ) coordinate system. Since this eruption is a backside event from the Earth, no accurate measurements of the CME parameters are available. To estimate the eruption direction of the CME, we approximated its direction based on the flare location observed by Solar Orbiter/Extreme Ultraviolet Imager (EUI; Rochus et al. 2020). The CME speed and density in the cone CME model were fine-tuned to match the shock arrival time observed at Solar Orbiter. The parameters of the cone CME used in the simulation are listed in Table 1. We acknowledge that the CME parameters are not tightly constrained by observations. However, the primary objective of the simulation was to qualitatively investigate the mechanisms that cause the observed IVD event and not a precise quantitative modeling of the CME dynamics. In the snapshots, the propagation speed in the western portion of the CME is faster than that in the eastern portion. This asymmetric expansion of the CME is due to variations in the upstream solar wind conditions, that is, the CME expands faster in fast streams. This is also evident from the meridional slices, where a faster expansion of the CME toward the southern hemisphere is observed, although the eruption direction of the CME is around 20 degrees in latitude. We note that the expansion of the CME and the shock it drives plays an important role in the particle acceleration and the resulting IVD (see the more detailed discussion below). In the equatorial plane snapshots, two observers are denoted: One observer is Solar Orbiter (SC1, shown in green), located at 163° in longitude and at 0.96 au initially connected to the western flank of the shock, and the other observer is the virtual observer (SC2, red), located 115° in longitude and also at 0.96 au, initially connected to the shock nose. We compared the model results between these two spacecraft to explore the possible reasons for the observed inverse velocity dispersion.
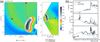 |
Fig. 3. Panel (a): equatorial (left) and meridional (right) snapshots of the radial solar wind speed from EUHFORIA. Panel (b): comparison of in situ plasma and magnetic field between observation and EUHFORIA simulation for the 2022 June 7 event. The panels from top to bottom present the solar wind proton number density, the solar wind speed, and the magnetic field magnitude. The blue and black lines show the EUHFORIA simulation results and measurements from Solar Orbiter, respectively. |
Input parameters of the cone CME model in EUHFORIA.
We further examined the plasma and magnetic field measurements by Solar Orbiter. The corresponding simulated time series of the solar wind parameters are shown in Fig. 3b. Based on the comparison between modeled and observed time series, Solar Orbiter likely passed through a stream interaction region and entered a fast solar wind stream before the flare eruption, which is evident from the number density peak observed around June 7 at 02:00 UT. Before the shock arrival, the plasma and magnetic field conditions were relatively undisturbed in the observation. Following the shock passage, a distinct sheath structure and a magnetic cloud are observed. The simulated shock arrival time and the magnitudes of the number density and flow speed near the shock are consistent with the observations, providing confidence that EUHFORIA simulations reasonably capture the shock propagation. However, we note that the cone model used in the simulations does not include the magnetic flux rope. Consequently, the model is unable to accurately reproduce the observed magnetic field disturbances, resulting in simulated magnetic field magnitudes during the passage of the CME that are not directly comparable to those recorded by Solar Orbiter.
To illustrate the evolution of the shock profile, Fig. 4 shows the time history of key shock parameters in the equatorial plane. The four panels represent the density compression ratio (s), the shock speed (Vshk), the shock obliquity (θBN), and the maximum proton energy (Emax). For this analysis, we assumed that Solar Orbiter is located in the solar equatorial plane, given its low latitude of 1.8°. The upper left panel depicts the evolution of the shock compression ratio. The highest compression ratios are observed at the shock nose, and the values decrease toward the shock flanks. Solar Orbiter initially connected to the shock flank, near the edge of the strong shock, and SC2 first connected to the shock nose, where the compression ratio remained consistently high. The upper right panel shows the evolution of shock speed. Two distinct regions of high shock speed are evident. One region corresponds to the shock expansion toward the eastern flank, and the other exhibits significant acceleration with time near the longitude of 180°. Near the Sun, the shock flank may be underdeveloped and can undergo further expansion as the shock propagates outward. This process is driven by the interaction between the expanding shock and the ambient solar wind, which enhances the lateral expansion of the shock structure. As a result, Solar Orbiter initially connected to the shock flank, where the shock speed was lower, and it subsequently transitioned to the shock nose, where the shock speed was higher. The bottom left panel illustrates the evolution of the shock obliquity angle θBN. A smooth transition in shock geometry is observed as the θBN increases from the eastern shock flank (quasi-parallel) to the western flank (quasi-perpendicular). The bottom right panel shows the maximum proton energy (Emax) along the shock front. This panel highlights that Solar Orbiter initially connected to the shock flank, where Emax was lower, before it gradually connected to regions with higher Emax. In contrast, SC2 initially connected to the shock nose, where higher Emax were present immediately following the eruption. Overall, this figure clearly illustrates the evolving nature of shock parameters and their role in shaping the particle acceleration environment. It demonstrates the importance of magnetic connectivity in determining the observed SEP characteristics.
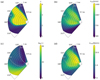 |
Fig. 4. Evolution of the shock location and shock parameters (shock compression ratio (a), shock speed (b), shock obliquity angle (c), and maximum proton energy (d)) in the equatorial plane. The solid black curves show the shock front at different time steps. The color schemes show different shock parameters along the shock front. The dashed white curves represent the Parker field lines passing through SC1 (Solar Orbiter) and SC2. |
To clearly demonstrate the different shock connectivities, Fig. 5 compares the shock parameters along the magnetic field lines connecting to SC1 (Solar Orbiter) and SC2. The two virtual observers initially connect to regions of the shock with high compression ratios, which gradually decrease over time. The most significant difference between the two observers is the evolution of the shock speed. SC1 initially connects to the shock flank and shifts toward the shock nose as the shock propagates. The shock speed along the path line of SC1 gradually increases until ∼0.4 au, after which it plateaus and gradually decreases until the shock arrival. In contrast, SC2 initially connects directly to the shock nose, where the shock speed remains nearly constant around 1200 km/s up to 0.6 au, and thereafter, the path line of SC2 connects to the shock flank farther away from the nose. The increase in the shock speed observed along the path line of SC1 is attributed to the shift from the shock flank to the shock nose and to the faster shock expansion in the fast solar wind. Regarding shock geometry, SC1 initially connects to an oblique shock with θBN ∼ 50° following the onset, and it gradually transitions to a more quasi-parallel shock as the connection shifts. Conversely, SC2 remains connected to a quasi-parallel shock throughout the period before the shock arrival. The variations in the shock parameters eventually influence the evolution of the maximum proton energy Emax observed at the two virtual spacecraft. SC1 initially connects to the shock flank, where Emax ∼ 2 MeV. As the connection moves closer to the shock nose, Emax peaks around 10 MeV before declining. In contrast, the initial connection of SC2 to the shock nose results in a higher initial Emax ∼ 30 MeV, which subsequently decreases as the connection shifts toward the shock flank. This is a result of the higher compression ratio and shock speed at the nose close to the Sun, which provides a more efficient particle acceleration early in the event. Overall, these comparisons highlight the evolving maximum particle energy in different magnetic connections and underscore the importance of shock evolution in determining particle acceleration efficiencies at different locations of the shock.
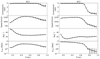 |
Fig. 5. Radial evolution of the shock parameters along the field line connecting to SC1 (Solar Orbiter) and SC2. From top to bottom, we show the shock compression ratio, shock speed, shock obliquity angle, and maximum proton energy. The error bars represent the uncertainty in the field line connection, corresponding to a 2° angular deviation near the observer. |
This is a key result in explaining the delayed onset of high-energy particles, driven by the observer’s evolving magnetic connection to regions of the shock with increasing Emax as the shock propagates through the inner heliosphere. As the observer initially connects to the shock flank, where Emax is lower, only lower-energy particles are detected. Over time, as the magnetic connection moves to a region along the shock front where Emax is higher, particles with higher energies begin to arrive, resulting in the observed inverse velocity dispersion.
Figure 6 shows the modeled dynamic spectra as observed by SC1 and SC2 within 24 hours after the CME eruption. The upper panels represent the case without cross-field diffusion in the transport process, providing a straightforward interpretation of how shock connectivity drives the observed VD and IVD. In the upper left panel, the clear IVD pattern is evident, with a nose energy around 2 MeV. Above this energy, the particle arrival time gradually increases with energy, and it is observed as inverse velocity dispersion. This behavior directly correlates with the evolution of the maximum proton energy along the magnetic field line connecting to SC1. Since cross-field diffusion is not included, accelerated particles can only propagate along the field line. As the maximum particle energy along this connection increases over time, higher-energy particles arrive later, which explains the delayed onset of the higher-energy particles. The step-like jumps shown in the IVD part are caused by the discrete time-dependent acceleration source, as discussed in Sect. 2. In contrast, the upper right panel, representing SC2, shows a distinct VD pattern. SC2 maintains a direct connection to the shock nose following the eruption, allowing for immediate access to the highest-energy particles. As a result, a typical velocity dispersion is observed, with higher-energy particles arriving first, followed by lower-energy particles.
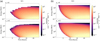 |
Fig. 6. Modeled proton dynamic spectra observed at SC1 (a) and SC2 (b). The upper panels show the case without cross-field diffusion, and the lower panels show the case with cross-field diffusion. |
The lower panels display the modeled results that include cross-field diffusion in the transport process. We assumed a reference value of κ⊥/κ∥ = 0.0017 for 1 MeV protons at 1 au, as discussed in Sect. 2. By comparing the SC1 results (left panels), we clearly find that the nose energy is slightly higher when cross-field diffusion is included. This occurs because cross-field diffusion enables the observer to sample a broader region of the shock front, and the observer is not restricted to a single point along the magnetic field line. Consequently, higher-energy particles from regions of the shock with greater Emax can propagate to the observer, resulting in a higher nose energy. Moreover, cross-field diffusion reduces the duration of the IVD phase compared to the case without cross-field diffusion because higher-energy particles initially released from different regions of the shock can reach the observer earlier by crossing field lines. This highlights an important insight: To observe clear IVD signatures, the influence of cross-field diffusion must be limited. Large cross-field diffusion (e.g., κ⊥/κ∥ > 0.01) may mask IVD by allowing the rapid propagation of high-energy particles across magnetic field lines. This finding agrees well with the results presented by Kouloumvakos et al. (2025). In the case of SC2, where the observer is already well connected to the shock nose, the inclusion of cross-field diffusion does not change the results greatly. As demonstrated by Ding et al. (2022b), cross-field diffusion plays a more critical role for poorly connected observers, while its effect on well-connected events remains relatively minor. The comparison of the dynamic spectra of four individual EPT telescopes, as shown in Appendix A, confirms that this event was anisotropic at Solar Orbiter. These results emphasize that IVD signatures are closely tied to the evolving shock connectivity along the magnetic field line.
To further investigate the uncertainty in magnetic connectivity, Fig. 7 compares the dynamic spectra and time-intensity profiles at three longitudes, separated by 5 degrees around the location of Solar Orbiter (longitude of 163°). Five energy channels were selected to match those in Fig. 1 for comparison. These results include the effects of perpendicular diffusion, as discussed in Sect. 3.2, to better reproduce the gradual enhancement of the particle intensity observed in situ. In the upper panels, variations in nose energy and the duration of the IVD are evident at different longitudes. As expected, the nose energy increases when the magnetic footpoint is closer to the shock nose, and the duration of the IVD becomes shorter. The modeled time-intensity profiles at Solar Orbiter in the middle panel show a more rapid enhancement of the particle intensity than the observations. A more consistent match with observations is found at a longitude of 168°, where the modeled results display a slower enhancement and a longer IVD duration. This discrepancy suggests that Solar Orbiter may initially have a poorer magnetic connectivity to the shock, and that the limited cross-field diffusion contributes to the gradual increase in particle intensity during the early phase of the event. These results indicate that IVD events may be more pronounced in poorly connected SEP events. We note that the modeled results exhibit a significantly harder energy spectrum than the observations, suggesting that the EUHFORIA simulation overestimated the shock compression ratio in the region that is magnetically connected to the observer. The current simulation is primarily constrained by the shock arrival time observed by Solar Orbiter, making it challenging to achieve a lower shock compression ratio in the model.
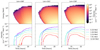 |
Fig. 7. Modeled proton dynamic spectra and time-intensity profiles at longitudes of 168°, 163° (Solar Orbiter), and 158°. |
To summarize the findings of this work, Fig. 8 shows a schematic representation of the shock connectivity at two distinct time steps, T1 and T2. T1 corresponds to the CME eruption time, and T2 represents a later stage during the shock propagation. In both panels, two observers, S1 and S2, connect to the shock front through the mean magnetic field line (solid lines) and meandering field lines (dashed lines). S1 and S2 represent poorly connected and well-connected observers, respectively. The notation ETx, Sxmax indicates the maximum proton energy connected to observer Sx at time Tx. For S1, the magnetic connection at T2 corresponds to a higher maximum particle energy as ET2, S1max > ET1, S1max. In contrast, S2 connects to the highest Emax at T1, with ET1, S2max > ET2, S2max. As a result, observer S1 is expected to detect an inverse velocity dispersion at later times, while observer S2 will observe a velocity dispersion throughout the event. It is important to note that Emax does not necessarily correspond to the maximum particle energy at the shock location directly connected to the observer. Instead, particles with higher energies may originate from different regions of the shock and propagate across magnetic field lines through cross-field diffusion. This highlights the critical role of the limited cross-field diffusion in shaping the observed characteristics of IVD events.
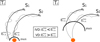 |
Fig. 8. Schematic of the shock connectivity at two time steps, T1 and T2. ETx, Sxmax indicates the maximum proton energy connected to observer Sx at time Tx. |
4. Conclusion and discussion
We investigated the inverse velocity dispersion in the SEP event observed by Solar Orbiter on 2022 June 7. This event exhibited a distinct and long-duration IVD signature that persisted for approximately 10 hours at a proton energy range from 1 MeV to 20 MeV. Measurements of ions also revealed a clear IVD signature, with varying nose energies corresponding to different ion species. To explore the possible mechanisms that cause the formation of IVD, we employed the HEPAT model to simulate shock acceleration and particle transport for this SEP event. The simulation results suggest that the observed IVD is closely linked to the evolving maximum particle energy at the shock front along the magnetic connectivity. This highlights the importance of considering time-dependent shock acceleration and transport processes in the interpretation of IVD events. Our main findings are summarized below.
-
The long-duration IVD event was driven by an evolving shock connectivity during the shock propagation. As the magnetic connection of Solar Orbiter to the shock transitioned from the flank to the nose, the observed maximum particle energy (Emax) increased, which led to the delayed arrival of high-energy particles and the formation of the IVD signature.
-
The effect of cross-field diffusion is limited for IVD events. Moderate cross-field diffusion may shorten the duration of IVD and increase the observed nose energy, but large cross-field diffusion may mask the IVD by allowing high-energy particles to propagate rapidly across magnetic field lines.
-
Interplanetary shock expansion may enhance acceleration efficiency at larger solar distances, creating favorable conditions for sustained particle acceleration. This process contributes to the development of IVD features by accelerating higher-energy particles at later times.
In this simulation, the shock was initiated at 0.1 au, which limited our ability to model coronal shocks directly. It is important to note that shock expansion also frequently occurs in the corona, as demonstrated by Kouloumvakos et al. (2025), who highlighted the critical influence of expanding coronal shocks in generating IVD events. For the IVD events of 2022 September 5 observed by PSP, Kouloumvakos et al. (2025) found that the coronal shock initially was subcritical and transitioned to a supercritical state, which allowed a generation of higher-energy particles at later times. On the other hand, Kouloumvakos et al. (2025) also suggested that cross-field diffusion appeared negligible in the PSP event. The primary reason for limiting cross-field diffusion effects in IVD events is to preserve the properties of the shock evolution along the field line. Therefore, the combined findings of Kouloumvakos et al. (2025) and this study suggest that shock evolutions and evolving magnetic connectivity from the corona to the heliosphere are key factors in producing IVD signatures by promoting efficient acceleration at later stages of the shock evolution. The PSP event occured close to the Sun and was primarily linked to the local shock evolution in the corona. However, based on our simulation results, which accounted for IP shock acceleration, we propose that long-duration IVD events are more commonly associated with SEP events, for which the observer’s magnetic footpoint is located west of the flare site. This configuration might facilitate a gradual transition of the magnetic connectivity from the shock flank to the shock nose, which would increase the likelihood of encountering stronger shock regions at later times. However, this is not absolute because the solar wind conditions and shock evolution can be highly dynamic (Wijsen et al. 2023; Ding et al. 2024). Connectivity can be far more complex due to the enhanced turbulence around the shock, as suggested by Zank et al. (2000). This complexity in turn can influence the effective magnetic connectivity. The escaped particles may be from a site different from that suggested by the simulated shock geometry and the interplanetary magnetic field.
In addition to the combined effects of magnetic connectivity and shock evolution, another potential explanation for IVD events is the longer acceleration time required for higher-energy particles by the DSA process, resulting in their delayed release. In our model, we accounted for the acceleration time in DSA, as described by Eq. (1), to calculate the maximum particle energy at the shock front. Notably, the instantaneous Emax at a traveling shock does not necessarily increase with longer acceleration times because as the shock propagates outward, the decay in the magnetic field strength increases the diffusion coefficient near the shock, thereby reducing the acceleration efficiency (Zank et al. 2000; Rice et al. 2003; Zank et al. 2006). The role of the acceleration time might be more significant in scenarios in which the diffusion coefficient and shock properties remain relatively constant. This is more likely during a short period when the young shock is still close to the Sun. While we did not explicitly explore the effects of acceleration time on IVD events in this study, a more comprehensive investigation of the acceleration time was reported by Li et al. (2025).
Considering the natural explanation for IVD events and their observation across all heliocentric distances covered by Solar Orbiter, the question arises as to why these events have not been reported previously. We searched data from the Solar Electron and Proton Telescope (SEPT; Müller-Mellin et al. 2008) on board STEREO and did indeed find a number of such events. However, they are not as easily recognizable because SEPT has a lower energy resolution than Solar Orbiter/EPT, which probably explains why they have not been reported previously. Although IVD detections are becoming more frequent, particularly through the high-resolution SEP measurements from Solar Orbiter/EPD, it is equally critital to understand why IVD events remain relatively uncommon in SEP observations. This study highlighted two key lessons in this regard. First, IVD events require the late release of high-energy particles, which may need the transition of magnetic connectivity from a weak to a strong shock. These conditions might depend on specific factors, such as the significant IP shock expansions (Manchester et al. 2017) and CME–CME interactions (Lugaz et al. 2017). Second, large cross-field diffusion can obscure IVD features by efficiently enabling particle transport across magnetic field lines, and thereby, mixing contributions from a wide range of sources along the shock. The effects of cross-field diffusion can vary significantly from event to event due to the different turbulence levels in the solar wind, and they can accumulate over larger solar distances. This might explain the relative scarcity of IVD in SEP events.
In conclusion, this study suggests that long-duration IVD events are driven by evolving shock connectivity during the shock propagation, where the observed maximum particle energy increases along the magnetic field line over time. Currently, the underlying mechanisms that cause IVD events remain an open question. While an explanation based on the acceleration time may not necessarily require a specific longitudinal location along the shock front, it likely requires proximity to a sufficiently young shock near the Sun. In contrast, a connectivity-based explanation may depend on a particular magnetic connection, which is more likely linked to the western flank of the shock at the onset and later shifts to the shock nose. Continued observational and modeling efforts are crucial to fully understand the factors driving IVD events and to refine our interpretations. To date, Solar Orbiter has detected over ten candidate IVD events. Future statistical studies will be pursued by exploring the relationship between the IVD characteristics and shock properties.
Acknowledgments
We thank Gary Zank for his helpful comments. Solar Orbiter is a mission of international cooperation between ESA and NASA, operated by ESA. This work was supported by the German Federal Ministry for Economic Affairs and Energy and the German Space Agency (Deutsches Zentrum für Luft- und Raumfahrt, e.V., (DLR)), grant number 50OT2002. The UAH team acknowledges the financial support by Project PID2023-150952OB-I00 funded by MICIU/AEI/10.13039/501100011033 and by FEDER, UE. The Suprathermal Ion Spectrograph (SIS) is a European facility instrument funded by ESA under contract number SOL.ASTR.CON.00004. Solar Orbiter post-launch work at JHU/APL and the Southwest Research Institute is supported by NASA contract NNN06AA01C. This research was supported in part through high-performance computing resources available at the Kiel University Computing Centre.
References
- Axford, W. 1981, in Symposium-International Astronomical Union (Cambridge University Press), 94, 339 [Google Scholar]
- Axford, W., Leer, E., & Skadron, G. 1977, International Cosmic Ray Conference, 11, 132 [Google Scholar]
- Bell, A. R. 1978, Monthly Notices of the Royal Astronomical Society, 182, 147 [Google Scholar]
- Cane, H. V., Reames, D. V., & von Rosenvinge, T. T. 1988, Journal of Geophysical Research: Space Physics, 93, 9555 [Google Scholar]
- Cohen, C. M. S., Leske, R. A., Christian, E. R., et al. 2024, ApJ, 966, 148 [NASA ADS] [CrossRef] [Google Scholar]
- Desai, M., & Giacalone, J. 2016, Living Reviews in Solar Physics, 13, 3 [NASA ADS] [CrossRef] [Google Scholar]
- Desai, M. I., Mason, G. M., Dayeh, M. A., et al. 2016, ApJ, 828, 106 [NASA ADS] [CrossRef] [Google Scholar]
- Ding, Z. 2024, PhD Thesis, Katholieke University of Leuven, Belgium [Google Scholar]
- Ding, Z.-Y., Li, G., Hu, J.-X., & Fu, S. 2020, Research in Astronomy and Astrophysics, 20, 145 [Google Scholar]
- Ding, Z., Li, G., Ebert, R. W., et al. 2022a, Journal of Geophysical Research (Space Physics), 127, e30343 [Google Scholar]
- Ding, Z., Wijsen, N., Li, G., & Poedts, S. 2022b, A&A, 668, A71 [NASA ADS] [CrossRef] [EDP Sciences] [Google Scholar]
- Ding, Z., Li, G., Dueñas, Santa Fe A., et al. 2023, Journal of Geophysical Research (Space Physics), 128, e2023JA031502 [Google Scholar]
- Ding, Z., Li, G., Mason, G., et al. 2024, A&A, 681, A92 [CrossRef] [EDP Sciences] [Google Scholar]
- Drury, L. O. 1983, Reports on Progress in Physics, 46, 973 [Google Scholar]
- Dwyer, J., Mason, G., Mazur, J., et al. 1997, The Astrophysical Journal, 490, L115 [Google Scholar]
- Fox, N. J., Velli, M. C., Bale, S. D., et al. 2016, Space Sci. Rev., 204, 7 [Google Scholar]
- Giacalone, J., & Jokipii, J. R. 1999, The Astrophysical Journal, 520, 204 [Google Scholar]
- Gordon, B. E., Lee, M. A., Möbius, E., & Trattner, K. J. 1999, Journal of Geophysical Research (Space Physics), 104, 28263 [Google Scholar]
- Horbury, T. S., O’Brien, H., Carrasco Blazquez, I., et al. 2020, A&A, 642, A9 [NASA ADS] [CrossRef] [EDP Sciences] [Google Scholar]
- Hu, J., Li, G., Ao, X., Zank, G. P., & Verkhoglyadova, O. 2017, Journal of Geophysical Research (Space Physics), 122, 938 [Google Scholar]
- Hu, J., Li, G., Fu, S., Zank, G., & Ao, X. 2018, The Astrophysical Journal Letters, 854, L19 [Google Scholar]
- Jokipii, J. R. 1966, ApJ, 146, 480 [Google Scholar]
- Kollhoff, A., Kouloumvakos, A., Lario, D., et al. 2021, A&A, 656, A20 [NASA ADS] [CrossRef] [EDP Sciences] [Google Scholar]
- Kouloumvakos, A., Wijsen, N., Jebaraj, I. C., et al. 2025, ApJ, 979, 100 [Google Scholar]
- Laitinen, T., Huttunen-Heikinmaa, K., Valtonen, E., & Dalla, S. 2015, ApJ, 806, 114 [Google Scholar]
- Lee, M. A. 1983, Journal of Geophysical Research (Space Physics), 88, 6109 [Google Scholar]
- Li, G., Zank, G. P., & Rice, W. K. M. 2003, Journal of Geophysical Research (Space Physics), 108, 1082 [Google Scholar]
- Li, G., Zank, G. P., & Rice, W. K. M. 2005, Journal of Geophysical Research (Space Physics), 110, A06104 [Google Scholar]
- Li, G., Zank, G. P., Verkhoglyadova, O., et al. 2009, ApJ, 702, 998 [NASA ADS] [CrossRef] [Google Scholar]
- Li, G., Shalchi, A., Ao, X., Zank, G., & Verkhoglyadova, O. P. 2012, Advances in Space Research, 49, 1067 [Google Scholar]
- Li, G., Jin, M., Ding, Z., et al. 2021, The Astrophysical Journal, 919, 146 [Google Scholar]
- Li, Y., Guo, J., Pacheco, D., et al. 2025, National Science Review, submitted [Google Scholar]
- Lucas, J. M. 1985, Technometrics, 27, 129 [CrossRef] [Google Scholar]
- Lugaz, N., Temmer, M., Wang, Y., & Farrugia, C. J. 2017, Solar Physics, 292, 1 [CrossRef] [Google Scholar]
- Manchester, W., Kilpua, E. K., Liu, Y. D., et al. 2017, Space Science Reviews, 212, 1159 [Google Scholar]
- Mason, G. M., Li, G., Cohen, C. M. S., et al. 2012, ApJ, 761, 104 [NASA ADS] [CrossRef] [Google Scholar]
- Matthaeus, W. H., Qin, G., Bieber, J. W., & Zank, G. P. 2003, ApJ, 590, L53 [Google Scholar]
- McCracken, K. G., & Rao, U. R. 1970, Space Sci. Rev., 11, 155 [Google Scholar]
- Müller, D., St. Cyr, O. C., Zouganelis, I., et al. 2020, A&A, 642, A1 [Google Scholar]
- Müller-Mellin, R., Böttcher, S., Falenski, J., et al. 2008, Space Sci. Rev., 136, 363 [Google Scholar]
- Odstrcil, D., Riley, P., & Zhao, X. P. 2004, J. Geophys. Res., 109, A02116 [Google Scholar]
- Owen, C. J., Bruno, R., Livi, S., et al. 2020, A&A, 642, A16 [EDP Sciences] [Google Scholar]
- Pomoell, J., & Poedts, S. 2018, Journal of Space Weather and Space Climate, 8, A35 [Google Scholar]
- Reames, D. V. 1999, Space Sci. Rev., 90, 413 [NASA ADS] [CrossRef] [Google Scholar]
- Reames, D. V. 2013, Space Sci. Rev., 175, 53 [CrossRef] [Google Scholar]
- Reames, D. V., Barbier, L. M., Von Rosenvinge, T. T., et al. 1997, ApJ, 483, 515 [Google Scholar]
- Rice, W. K. M., Zank, G. P., & Li, G. 2003, Journal of Geophysical Research (Space Physics), 108, 1369 [Google Scholar]
- Rochus, P., Auchere, F., Berghmans, D., et al. 2020, A&A, 642, A8 [NASA ADS] [CrossRef] [EDP Sciences] [Google Scholar]
- Rodríguez-Pacheco, J., Wimmer-Schweingruber, R. F., Mason, G. M., et al. 2020, A&A, 642, A7 [Google Scholar]
- Rouillard, A. P., Odstřcil, D., Sheeley, N. R., et al. 2011, ApJ, 735, 7 [Google Scholar]
- Rouillard, A. P., Sheeley, N. R., Tylka, A., et al. 2012, ApJ, 752, 44 [CrossRef] [Google Scholar]
- Shalchi, A. 2009, Nonlinear Cosmic Ray Diffusion Theories (Springer), 362 [Google Scholar]
- Shalchi, A., Li, G., & Zank, G. 2010, Astrophysics and Space Science, 325, 99 [Google Scholar]
- Skilling, J. 1971, ApJ, 170, 265 [NASA ADS] [CrossRef] [Google Scholar]
- Strauss, R. D., Dresing, N., & Engelbrecht, N. E. 2017, The Astrophysical Journal, 837, 43 [Google Scholar]
- Tylka, A. J., Cohen, C. M. S., Dietrich, W. F., et al. 2003, International Cosmic Ray Conference, 6, 3305 [Google Scholar]
- Verkhoglyadova, O. P., Li, G., Zank, G. P., Hu, Q., & Mewaldt, R. A. 2009, The Astrophysical Journal, 693, 894 [Google Scholar]
- Verkhoglyadova, O. P., Li, G., Zank, G. P., et al. 2010, Journal of Geophysical Research (Space Physics), 115, A12103 [Google Scholar]
- Verkhoglyadova, O. P., Zank, G. P., & Li, G. 2015, Phys. Rep., 557, 1 [Google Scholar]
- Wang, Y., Qin, G., & Zhang, M. 2012, The Astrophysical Journal, 752, 37 [Google Scholar]
- Wijsen, N., Aran, A., Pomoell, J., & Poedts, S. 2019, A&A, 622, A28 [NASA ADS] [CrossRef] [EDP Sciences] [Google Scholar]
- Wijsen, N., Lario, D., Sánchez-Cano, B., et al. 2023, ApJ, 950, 172 [NASA ADS] [CrossRef] [Google Scholar]
- Wimmer-Schweingruber, R. F., Janitzek, N. P., Pacheco, D., et al. 2021, A&A, 656, A22 [NASA ADS] [CrossRef] [EDP Sciences] [Google Scholar]
- Wimmer-Schweingruber, R. F., Berger, L., Kollhoff, A., et al. 2023, A&A, 678, A98 [NASA ADS] [CrossRef] [EDP Sciences] [Google Scholar]
- Xu, Z., Guo, J., Wimmer-Schweingruber, R. F., et al. 2020, The Astrophysical Journal Letters, 902, L30 [Google Scholar]
- Zank, G. P., Rice, W. K. M., & Wu, C. C. 2000, Journal of Geophysical Research (Space Physics), 105, 25079 [Google Scholar]
- Zank, G. P., Li, G., Florinski, V., et al. 2006, Journal of Geophysical Research: Space Physics, 111, 1 [Google Scholar]
Appendix A: Supplementary figure of the 2022 June 7 event
Figure A.1 displays the color-coded ion intensities measured by the sunward, anti-sunward, north, and south telescopes of Solar Orbiter/EPT. A comparison of the intensities across different telescopes reveals a pronounced anisotropy in the particle distribution, with the majority of particles streaming away from the Sun. This indicates a sustained and prolonged injection of energetic particles near the Sun, suggesting continuous particle acceleration and release over an extended period, associated with extended shock acceleration.
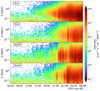 |
Fig. A.1. Ion intensities for the 2022 June 7 event measured by the sun, anti-sun, north, and south telescopes of Solar Orbiter/EPT. |
All Tables
All Figures
|
Fig. 1. Proton dynamic spectrum (upper panel) and time-intensity profiles (lower panel) for the 2022 June 7 event observed by STEP, EPT, and HET on board Solar Orbiter. The curved dashed line in the upper panel represents the onset times fit. The colored vertical lines in the lower panel indicate the onset times for each energy channel. The vertical solid line marks the CME eruption time, and the vertical dashed black line denotes the release time derived from VDA. |
| In the text | |
|
Fig. 2. Ion dynamic spectra for the 2022 June 7 events observed by Solar Orbiter/SIS. From top to bottom, the panels show measurements of protons, helium-4, carbon, oxygen, and iron ions. |
| In the text | |
|
Fig. 3. Panel (a): equatorial (left) and meridional (right) snapshots of the radial solar wind speed from EUHFORIA. Panel (b): comparison of in situ plasma and magnetic field between observation and EUHFORIA simulation for the 2022 June 7 event. The panels from top to bottom present the solar wind proton number density, the solar wind speed, and the magnetic field magnitude. The blue and black lines show the EUHFORIA simulation results and measurements from Solar Orbiter, respectively. |
| In the text | |
|
Fig. 4. Evolution of the shock location and shock parameters (shock compression ratio (a), shock speed (b), shock obliquity angle (c), and maximum proton energy (d)) in the equatorial plane. The solid black curves show the shock front at different time steps. The color schemes show different shock parameters along the shock front. The dashed white curves represent the Parker field lines passing through SC1 (Solar Orbiter) and SC2. |
| In the text | |
|
Fig. 5. Radial evolution of the shock parameters along the field line connecting to SC1 (Solar Orbiter) and SC2. From top to bottom, we show the shock compression ratio, shock speed, shock obliquity angle, and maximum proton energy. The error bars represent the uncertainty in the field line connection, corresponding to a 2° angular deviation near the observer. |
| In the text | |
|
Fig. 6. Modeled proton dynamic spectra observed at SC1 (a) and SC2 (b). The upper panels show the case without cross-field diffusion, and the lower panels show the case with cross-field diffusion. |
| In the text | |
|
Fig. 7. Modeled proton dynamic spectra and time-intensity profiles at longitudes of 168°, 163° (Solar Orbiter), and 158°. |
| In the text | |
|
Fig. 8. Schematic of the shock connectivity at two time steps, T1 and T2. ETx, Sxmax indicates the maximum proton energy connected to observer Sx at time Tx. |
| In the text | |
|
Fig. A.1. Ion intensities for the 2022 June 7 event measured by the sun, anti-sun, north, and south telescopes of Solar Orbiter/EPT. |
| In the text | |
Current usage metrics show cumulative count of Article Views (full-text article views including HTML views, PDF and ePub downloads, according to the available data) and Abstracts Views on Vision4Press platform.
Data correspond to usage on the plateform after 2015. The current usage metrics is available 48-96 hours after online publication and is updated daily on week days.
Initial download of the metrics may take a while.