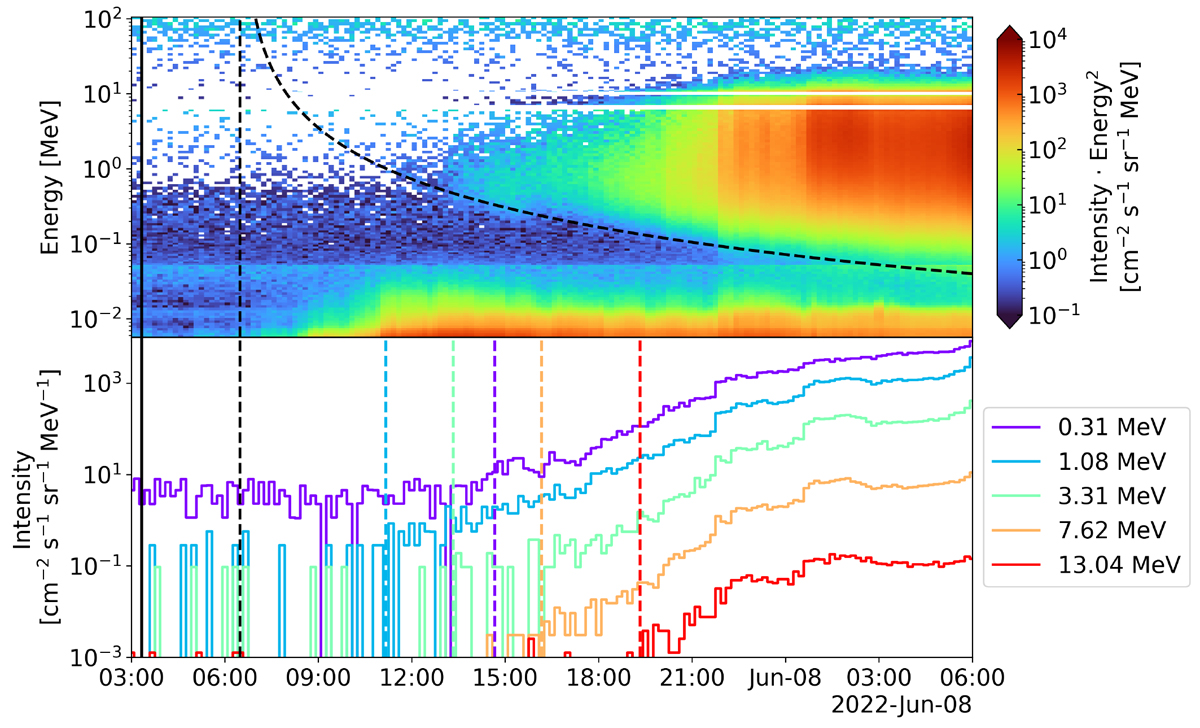
Fig. 1.
Download original image
Proton dynamic spectrum (upper panel) and time-intensity profiles (lower panel) for the 2022 June 7 event observed by STEP, EPT, and HET on board Solar Orbiter. The curved dashed line in the upper panel represents the onset times fit. The colored vertical lines in the lower panel indicate the onset times for each energy channel. The vertical solid line marks the CME eruption time, and the vertical dashed black line denotes the release time derived from VDA.
Current usage metrics show cumulative count of Article Views (full-text article views including HTML views, PDF and ePub downloads, according to the available data) and Abstracts Views on Vision4Press platform.
Data correspond to usage on the plateform after 2015. The current usage metrics is available 48-96 hours after online publication and is updated daily on week days.
Initial download of the metrics may take a while.