Fig. 4
Download original image
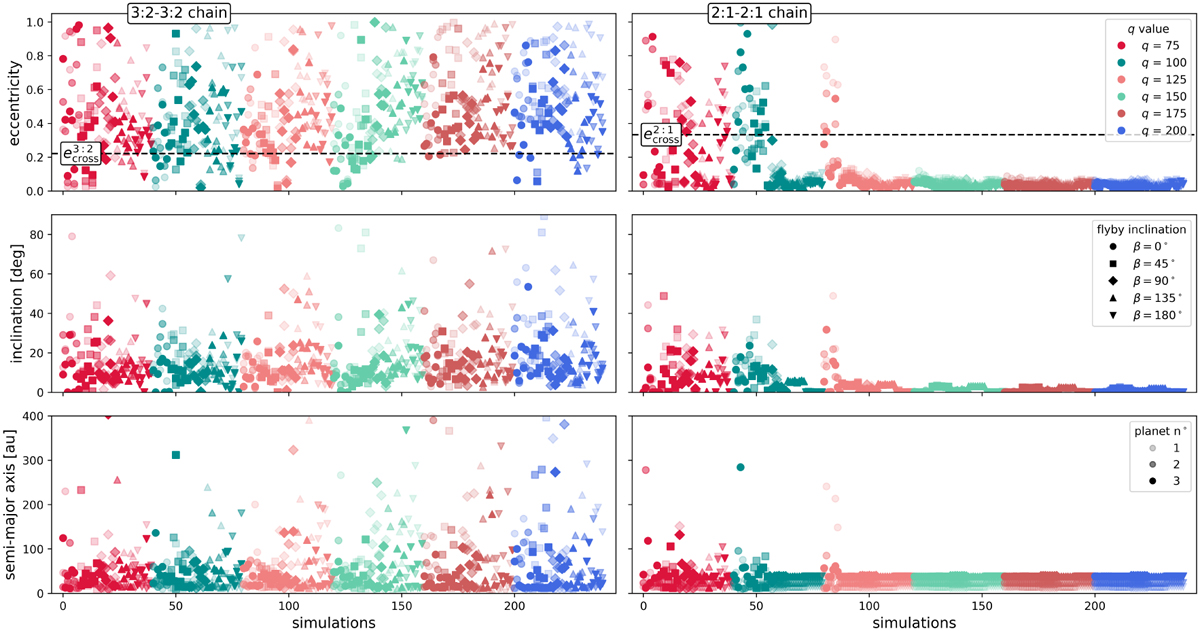
Delayed eccentricities (top row), inclinations (middle), and semi-major axis (bottom row) for all simulations in the 3:2-3:2 (left column) and 2:1-2:1 (right column) resonant chains. Colors indicate the pericentric distance q between the stars during the flyby event, with each color corresponding to a specific q, while the symbols represent the inclination β of the flyby star. The black dashed line indicates the stability limit given by the orbit-crossing value ecross.
Current usage metrics show cumulative count of Article Views (full-text article views including HTML views, PDF and ePub downloads, according to the available data) and Abstracts Views on Vision4Press platform.
Data correspond to usage on the plateform after 2015. The current usage metrics is available 48-96 hours after online publication and is updated daily on week days.
Initial download of the metrics may take a while.