Fig. 7.
Download original image
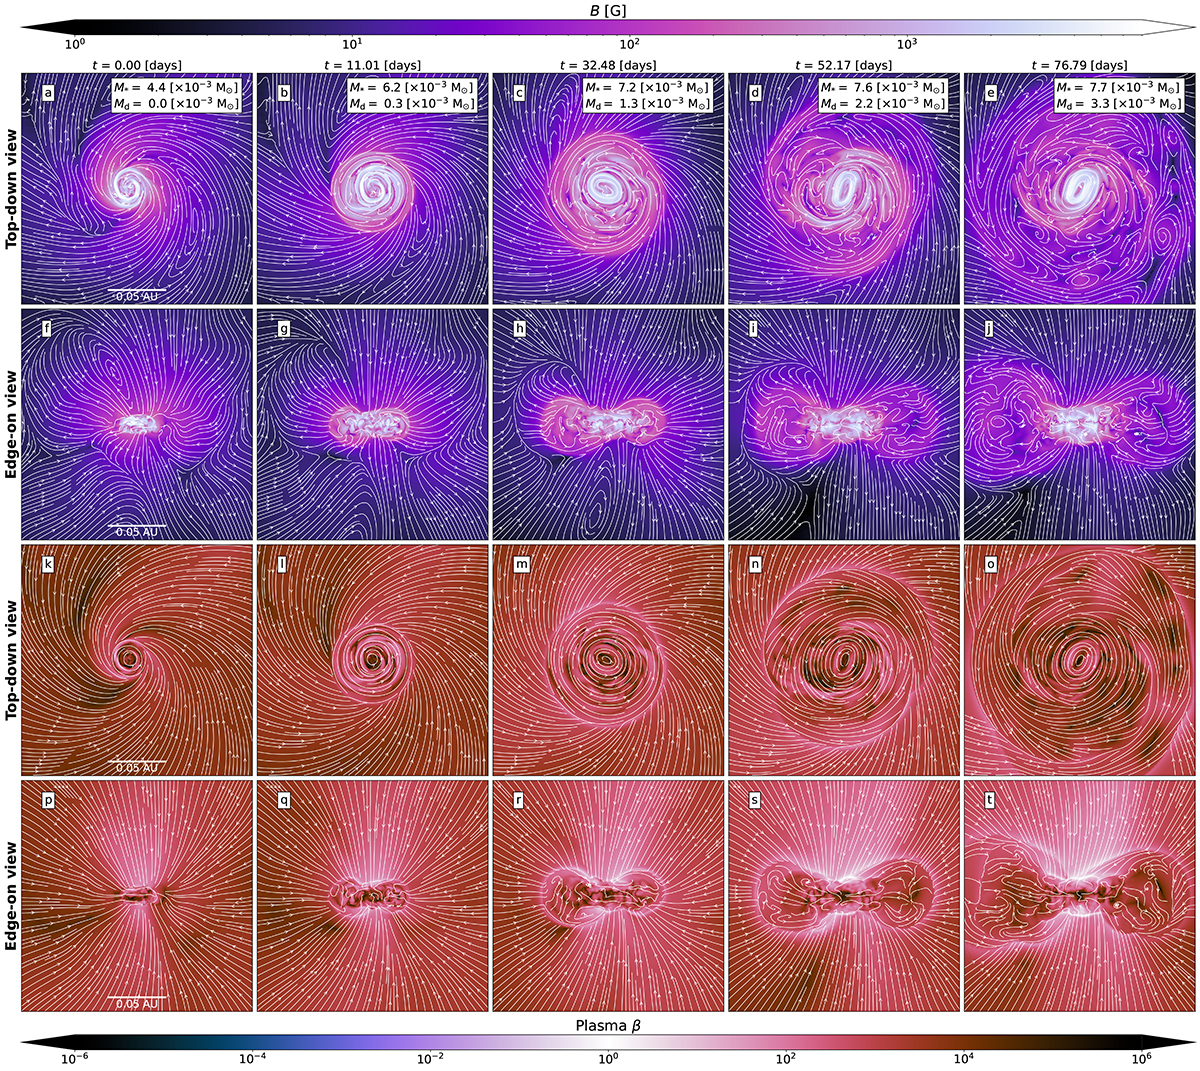
Magnetic field of run NIMHD: a set of slices displaying the magnetic field strength (top two rows) and plasma β (bottom two rows) in a top-down view (first and third rows) and an edge-on view(second and fourth rows). The white curves in the first two rows (panels a–j) are magnetic field streamlines, whereas in the last two rows (panels k–t) they are velocity vector field streamlines. Each column represents a different time, where t = 0 corresponds to the moment of protostellar birth. The mass of the protostar and its circumstellar disk are displayed in the top right corner of panels a–e. The scale bars in the first column apply to all the other columns as well.
Current usage metrics show cumulative count of Article Views (full-text article views including HTML views, PDF and ePub downloads, according to the available data) and Abstracts Views on Vision4Press platform.
Data correspond to usage on the plateform after 2015. The current usage metrics is available 48-96 hours after online publication and is updated daily on week days.
Initial download of the metrics may take a while.