Fig. 6.
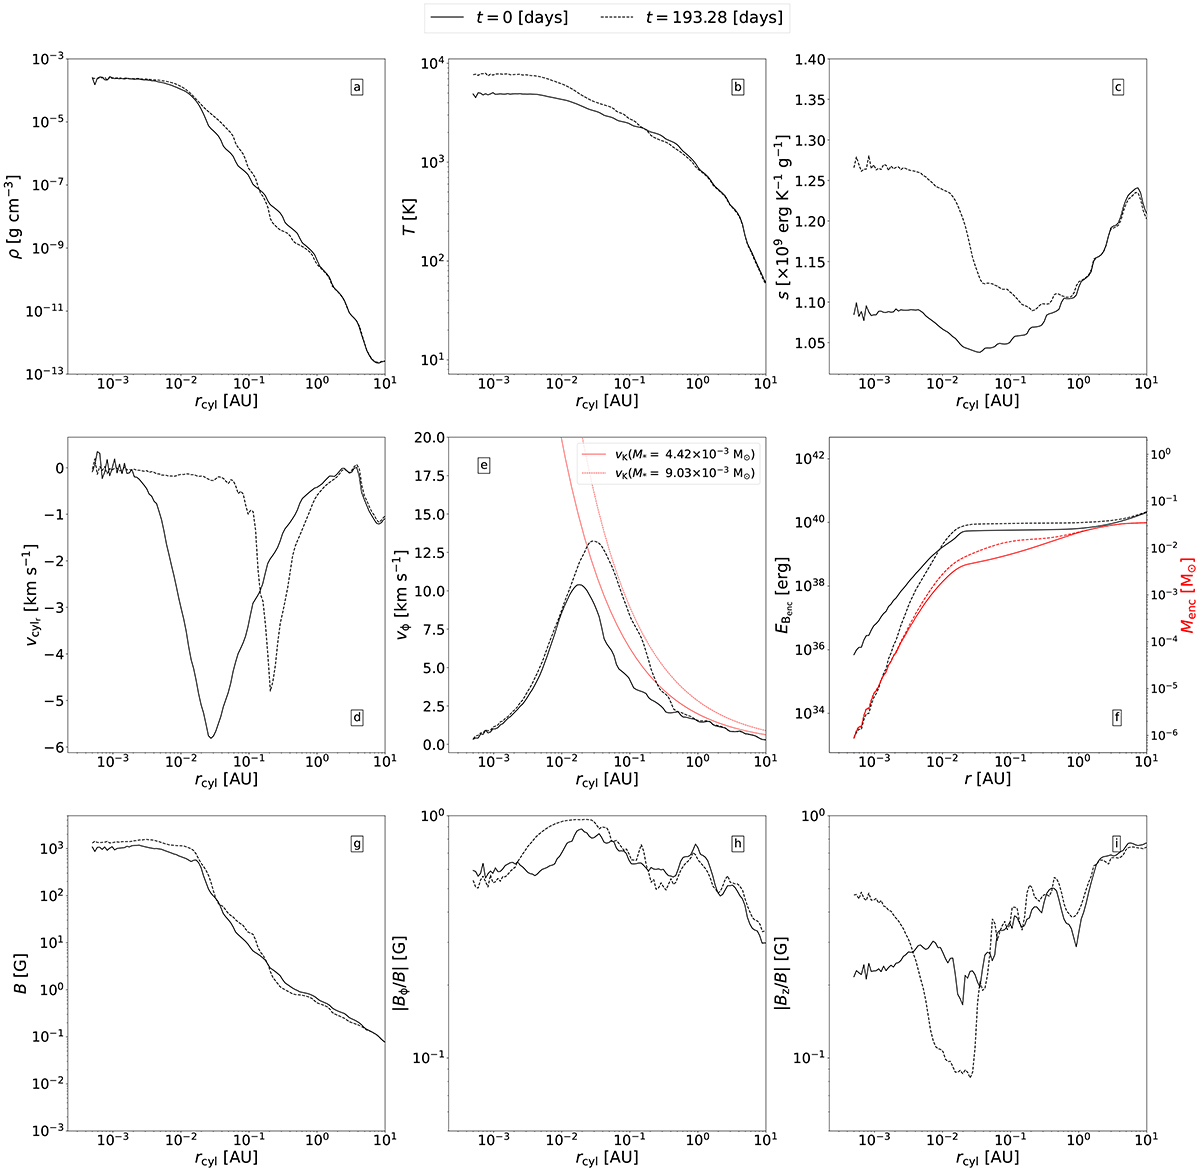
Download original image
Set of measurements of various physical properties of run NIMHD. These were done in cylindrical radial bins, in which only cells belonging to the midplane, defined as z ∈ [ − 2.5; 2.5]×10−2 AU, were used. The solid lines are measurements done at t = 0 (corresponding to the moment of protostellar birth), and the dotted lines are measurements done ≈190 days later. Panels (a), (b), and (c) display respectively the gas density, temperature, and specific entropy. Panels (d) and (e) display the gas (cylindrical) radial and azimuthal velocity. The red curves in panel (e) display the Keplerian velocity computed with the protostar’s mass at a given snapshot. Panels (g), (h), and (i) display the magnetic field strength, its toroidal component, and its vertical component. The toroidal and vertical components are normalized by the total magnetic field strength. Panel (f) displays the enclosed magnetic energy (black lines) and the enclosed mass (red lines) as a function of spherical radius.
Current usage metrics show cumulative count of Article Views (full-text article views including HTML views, PDF and ePub downloads, according to the available data) and Abstracts Views on Vision4Press platform.
Data correspond to usage on the plateform after 2015. The current usage metrics is available 48-96 hours after online publication and is updated daily on week days.
Initial download of the metrics may take a while.