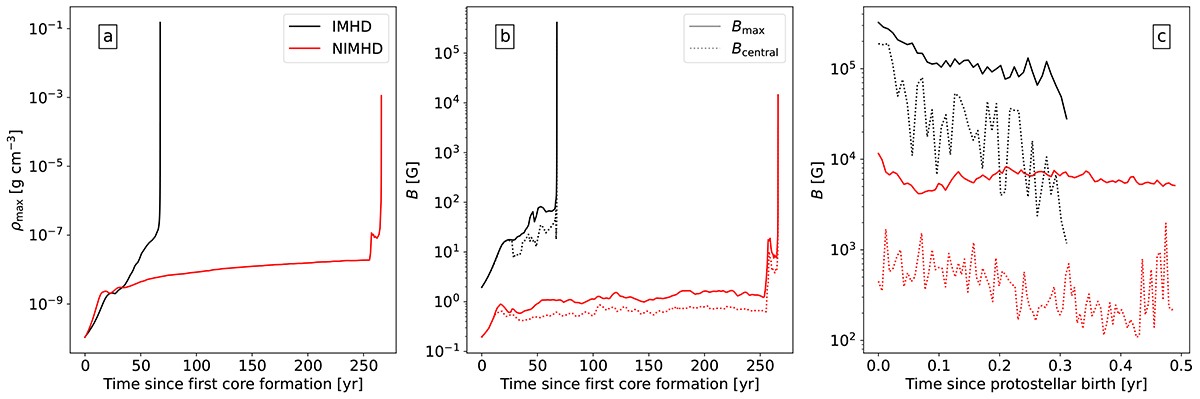
Fig. 2.
Download original image
Quantitative comparison of the collapse between run IMHD (black) and run NIMHD (red). Panel (a) displays the evolution of the maximum density since the formation of the first Larson core, which we define as the time when a density of ≈10−10 g cm−3 is achieved. Panels (b) and (c) display the magnetic field strength evolution as a function of time since first core formation and since protostellar birth (defined as the moment a density of ≈10−5 g cm−3 is reached), where the solid lines represent the maximum magnetic field strength and the dotted lines represent the field’s strength measured at the location of maximum density.
Current usage metrics show cumulative count of Article Views (full-text article views including HTML views, PDF and ePub downloads, according to the available data) and Abstracts Views on Vision4Press platform.
Data correspond to usage on the plateform after 2015. The current usage metrics is available 48-96 hours after online publication and is updated daily on week days.
Initial download of the metrics may take a while.