Fig. C1.
Download original image
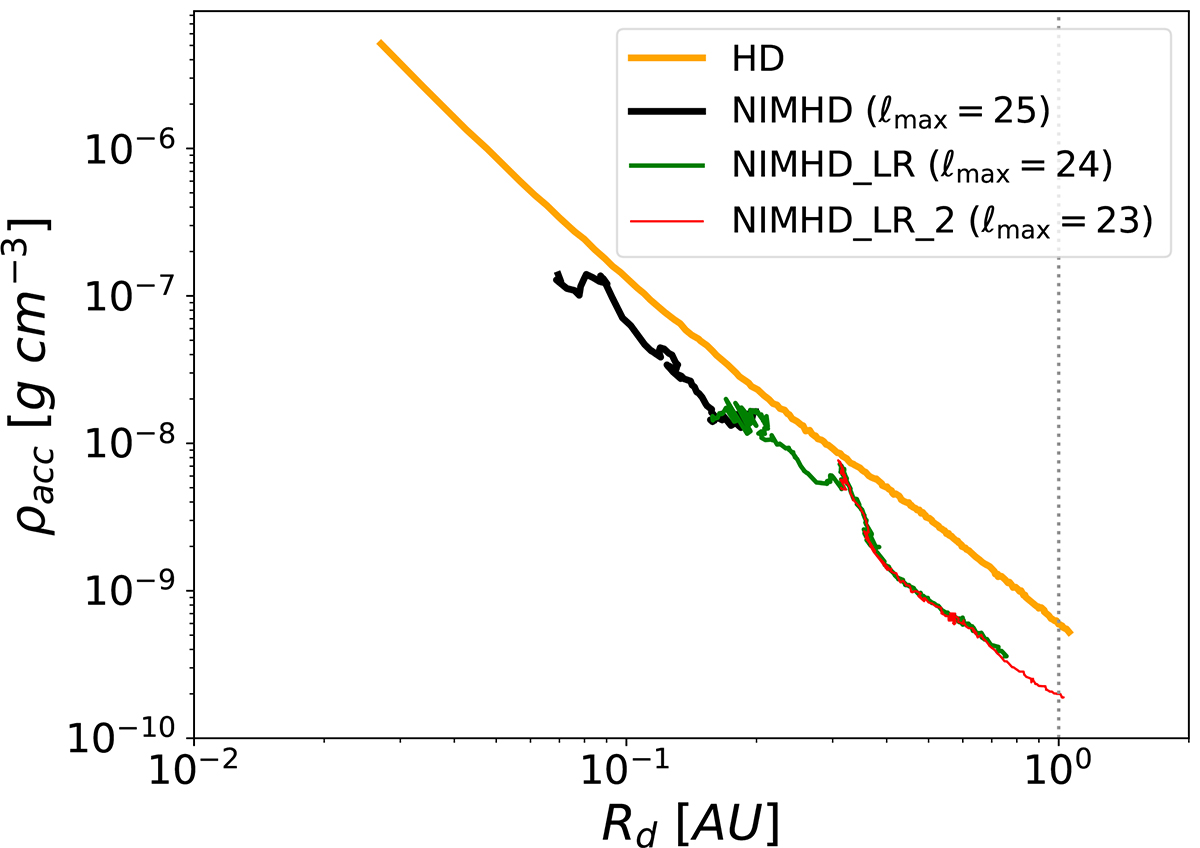
Density measured at the disk’s equatorial shock front as a function of the disk’s equatorial radius Rd, for run NIMHD (black curve) and its hydro counterpart (orange curve). The green curve is a zoom-out, branched from run NIMHD and run at a lower resolution with ℓmax = 24 (run NIMHD_LR), and the red curve is a zoom-out, branched out of run NIMHD_LR and run at ℓmax = 23 (run NIMHD_LR_2). The significant overlap between the results of NIMHD_LR and NIMHD_LR_2 (green and red curves) shows that the results of this doubly zoomed-out run are converged with regard to ρacc.
Current usage metrics show cumulative count of Article Views (full-text article views including HTML views, PDF and ePub downloads, according to the available data) and Abstracts Views on Vision4Press platform.
Data correspond to usage on the plateform after 2015. The current usage metrics is available 48-96 hours after online publication and is updated daily on week days.
Initial download of the metrics may take a while.