Fig. A.1.
Download original image
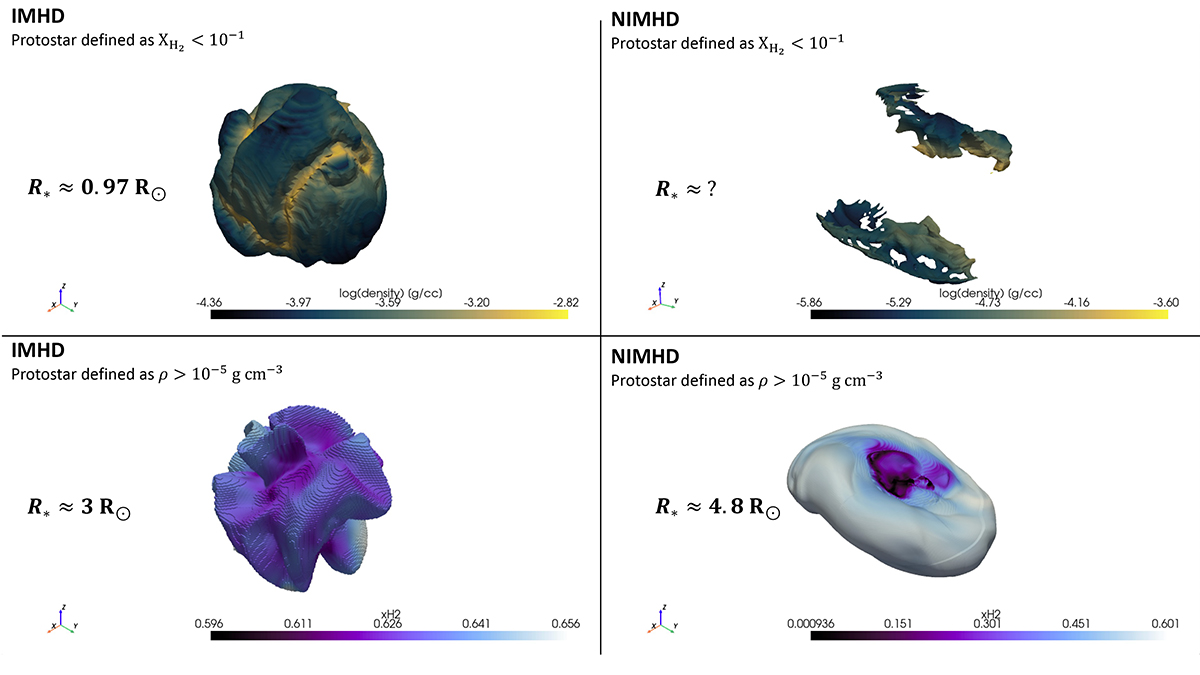
3D illustration of the two criteria used to define the protostar, as applied in run IMHD (first column) and run NIMHD (second column). The first row displays an isocontour of XH2 ≈ 10−1, whereas the second row displays an isocontour of ρ ≈ 10−5 g cm−3. The colorbar in the first (resp. second) row displays the gas density (resp. XH2) in the extracted surface.
Current usage metrics show cumulative count of Article Views (full-text article views including HTML views, PDF and ePub downloads, according to the available data) and Abstracts Views on Vision4Press platform.
Data correspond to usage on the plateform after 2015. The current usage metrics is available 48-96 hours after online publication and is updated daily on week days.
Initial download of the metrics may take a while.